Argentina Construction Equipment Market Report 2026-2031
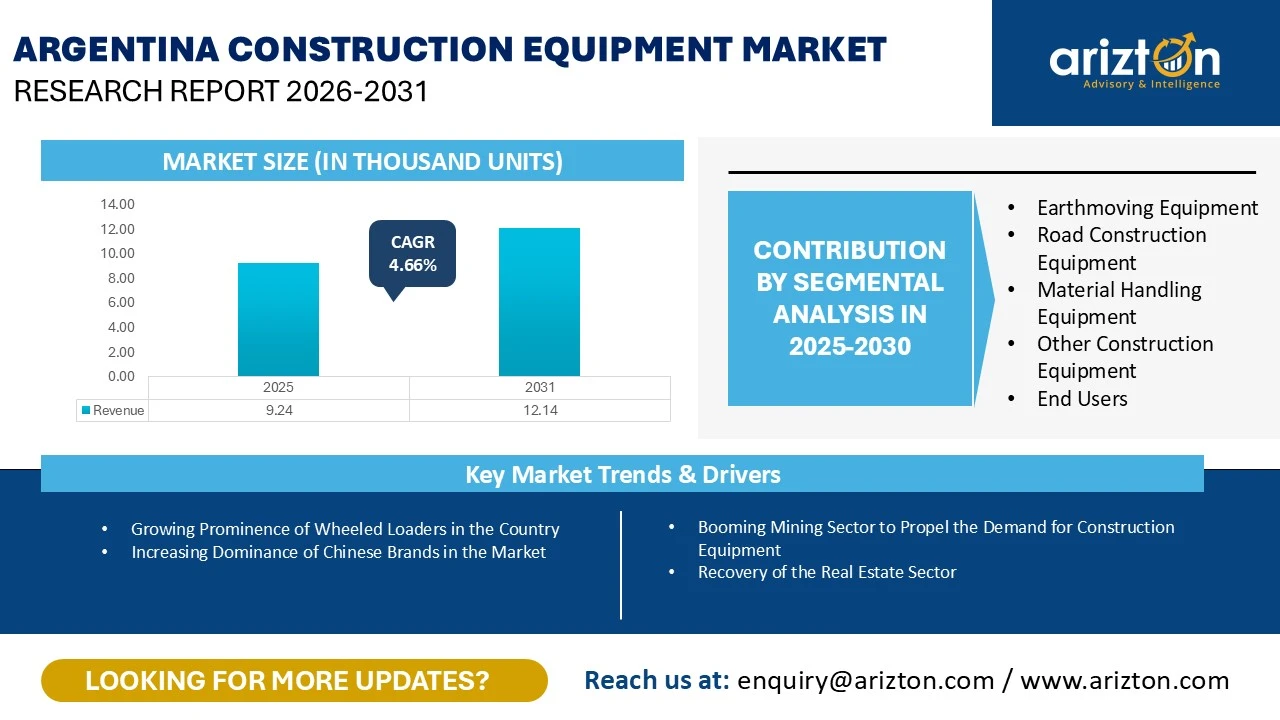
THE ARGENTINA CONSTRUCTION EQUIPMENT MARKET SIZE WAS ESTIMATED AT 9.24 THOUSAND UNITS IN 2025 AND IS EXPECTED TO REACH 12.14 THOUSAND UNITS BY 2031, GROWING AT A CAGR OF 4.66%

Argentina Construction Equipment Market Size & Share By Earthmoving Equipment, Road Construction Equipment, Material Handling Equipment. The Report Provides Sales Volume in Thousands of Units and Revenue in USD Million.
Published Date : January 2026
Last Updated : February 2026
format: PDF
edition : Fourth Edition
168 pages
08 tables
67 charts
1 region
1 countries
38 company
5 segments
Purchase Options
Argentina Construction Equipment Market Report 2026-2031
THE ARGENTINA CONSTRUCTION EQUIPMENT MARKET SIZE WAS ESTIMATED AT 9.24 THOUSAND UNITS IN 2025 AND IS EXPECTED TO REACH 12.14 THOUSAND UNITS BY 2031, GROWING AT A CAGR OF 4.66%
The Argentina Construction Equipment Market Research Report Includes Segments By
- Earthmoving Equipment: Excavator, Backhoe Loaders, Wheeled Loaders, and Other Earthmoving Equipment (Other Loaders, Bulldozers, Trenchers, and Motor Graders)
- Road Construction Equipment: Road Rollers and Asphalt Pavers
- Material Handling Equipment: Crane, Forklift & Telescopic Handlers, and Aerial Platforms (Articulated Boom Lifts, Telescopic Boom lifts, and Scissor lifts)
- Other Construction Equipment: Dumper, Concrete Mixer, and Concrete Pump Truck
- End Users: Construction, Mining, Manufacturing, and Other End Users
Industry Analysis Report, Regional Outlook, Growth Potential, Price Trends, Competitive Market Share & Forecast 2026–2031.
This report includes market data points, ranging from trend
analyses to market estimates & forecasts that you can customize
ARGENTINA CONSTRUCTION EQUIPMENT MARKET REPORT SCOPE
| REPORT ATTRIBUTE | DETAILS |
|---|---|
| MARKET SIZE- VOLUME (2031) | 12.14 Thousand Units |
| MARKET SIZE- VOLUME (2025) | 9.24 Thousand Units |
| CAGR- VOLUME (2025-2031) | 4.66% |
| MARKET SIZE- REVENUE (2031) | USD 991.1 Million |
| HISTORIC YEAR | 2022-2024 |
| BASE YEAR | 2025 |
| FORECAST YEAR | 2026-2031 |
| EQUIPMENT TYPE | Earthmoving Equipment, Road Construction Equipment, Material Handling Equipment, and Other Equipment |
| END-USERS | Construction, Mining, Manufacturing, and Others |
| KEY VENDORS | John Deere, LiuGong, Caterpillar, SANY, XCMG, Volvo CE, Komatsu, JCB, Zoomlion, HD Hyundai Construction Equipment, and Liebherr |
ARGENTINA CONSTRUCTION EQUIPMENT MARKET SIZE
The Argentina construction equipment market was estimated at 9.24 thousand units in 2025 and is projected to reach 12.14 thousand units by 2031, expanding at a CAGR of 4.66% during the forecast period. The construction equipment industry in Argentina is positioned for steady growth, supported by the country’s long-term infrastructure development strategy and increasing private sector participation.
In 2024, the government announced an infrastructure pipeline of nearly $452 billion through 2040 to bridge Argentina’s infrastructure gap, focusing on rail modernization, water systems, and road construction. These investments are strengthening the overall construction equipment industry in Argentina, creating sustained demand for heavy machinery in Argentina, including excavators in Argentina, loaders and bulldozers in Argentina, and graders in Argentina.
Mining remains a primary demand driver in the construction machinery market in Argentina, particularly for wheeled loaders and excavators, due to the country’s expanding lithium and copper extraction activities. Argentina’s mineral reserves continue to attract foreign direct investment, reinforcing long-term equipment requirements.
Chinese OEMs—including LiuGong, XCMG, SDLG, LOVOL, and SANY—currently lead the construction machinery suppliers landscape, outperforming U.S., Japanese, and European competitors such as Caterpillar, Komatsu, John Deere, and Volvo CE. Competitive pricing, broad product portfolios, and faster delivery timelines have strengthened their foothold in the construction equipment import in Argentina segment.
KEY HIGHLIGHTS
- Material Handling equipment accounted for the largest market share of the Argentina construction equipment market in 2025. Forklifts/Telescopic Handlers in the material handling segment accounted for the largest share in 2025. The country’s reliance on imports further drives the need for forklifts across warehouses and logistics centres.
- On the other hand, demand for earthmoving equipment is also growing due to the recovery of the real estate sector. The growing mining sector is also propelling the demand for earthmoving equipment in Argentina in 2025.
- The excavators and wheeled loaders equipment category holds the largest shares among earthmoving equipment in Argentina in 2025, driven by the ongoing extraction of lithium and copper. The BCR highlighted that the energy and mining sectors account for most submissions to the regime, with a combined weight of 98.3% of the total. Within that group, the mining sector represents 64.8% and the energy sector 33.5%, while the port infrastructure and steel sectors each contribute just 0.9%.
- The road construction equipment segment is estimated to reach $23.1 million by value by 2031, growing at a CAGR of 4.56%.
- Road roller sales are high in Argentina in response to the rising renovation and expansion of transport networks.
- The most significant catalyst for road construction equipment demand in 2025 is the Milei administration's large-scale highway privatization program, known as the Federal Concession Network (Red Federal de Concessiones). This initiative aims to concession approximately 9,154 kilometres of national roads across fourteen provinces, representing about 20% of Argentina's national roadway system.
- While economic headwinds and reliance on used equipment persist, the market is advancing in tandem with Argentina’s National Road Network Plan, resulting in a visible expansion of road roller unit sales.
- The National Road Network Plan ($35 billion) includes 2,800 km of new highways, 2,500 km of safer roads, rehabilitation of 13,000 km of existing roads, and 2,000 km of new surfaces through 2025–2029. This substantial investment is expected to boost the demand for road rollers in the country.
- Construction equipment utilization in the construction industry by end-user (volume) has the largest market share in 2025.
- In September 2025, construction activity registered a year-on-year increase of 6.8%, according to the Synthetic Indicator of Construction Activity (ISAC). This growth marks the eighth consecutive month of improvement for the sector, after a decline in 2024 caused by the suspension of public works and the general decrease in investment.
- The construction equipment used in the mining industry is undergoing significant expansion, primarily due to the growing mining and mineral extraction activities of the country. Argentina’s mining stands at a pivotal moment, supported by rising global demand for critical minerals and an increasingly favorable regulatory environment. Lithium continues to lead the sector’s expansion, positioning the country as a key strategic supplier in the global shift toward clean energy and electromobility.
- Meanwhile, copper is emerging as a major catalyst for future growth, with new investments expected to significantly enhance export capacity. The recently implemented RIGI regime strengthens the framework of predictability and stability, fostering conditions conducive to sustained, long-term investment.
ARGENTINA CONSTRUCTION EQUIPMENT MARKET DRIVERS
Booming Mining Sector to Propel the Demand for Construction Equipment
Lithium has emerged as the primary growth engine for Argentina's mining industry, with production rising exponentially in recent years. Argentina occupies a central position within the "Lithium Triangle" alongside Chile and Bolivia—a region containing over half of the world's brine reserves and accounting for the third-largest global production capacity.
Copper production represents a significant opportunity for Argentina. Although the country ceased domestic copper production with the closure of La Alumbrera in 2018, several world-class projects are advancing development.
Argentina's mining potential could increase total mineral exports fivefold to exceed $25 billion annually.
Recovery of the Real Estate Sector
A key indicator of this revival is the sharp rise in property deed registrations and a gradual reactivation of mortgage financing. Real estate market stabilization in the Buenos Aires metropolitan area became evident in early 2025.
High-end residential clusters, including Palermo, Belgrano, Canning, and Nordelta, also continue to perform strongly. Investors in these districts are increasingly prioritizing rental yields and long-term capital appreciation, encouraging the launch of new premium residential projects.
Rising investment flows are expected to convert into heightened construction activity—particularly refurbishments, adaptive reuse, and new rental housing supply—boosting equipment demand across urban centers.
ARGENTINA CONSTRUCTION EQUIPMENT MARKET TRENDS
Growing Prominence of Wheeled Loaders in the Country
The primary catalyst for growth is the rapid and substantial expansion of Argentina’s lithium mining sector. Argentina aims to boost lithium production by 75% in 2025, with production expected to reach 130,800 tonnes of lithium carbonate equivalent (LCE). This represents a shift from 74,600 tonnes produced in 2024
Rio Tinto's Rincón project in Salta Province received government approval for a $2.5 billion investment in May 2025, marking a critical milestone for the company. The project is expected to produce 20,000 tonnes annually of lithium carbonate and will require extensive earthmoving and material handling equipment throughout its operational phases.
Increasing Dominance of Chinese Brands in the Market
LiuGong has strengthened its market penetration through its long-standing partnership with ZMG, its exclusive distributor in Argentina. ZMG—operating as LiuGong’s representative for 17 years—achieved notable recognition at the 2023
A key driver of Chinese manufacturers’ success in Argentina is their competitive pricing relative to other brands. While equipment from Caterpillar, Komatsu, and Hitachi typically commands premium prices, Chinese suppliers offer cost-effective alternatives characterized by reliable performance, broad product portfolios, and shorter delivery lead times.
Additionally, China’s leading manufacturers—such as XCMG and SANY—have aligned their offerings with sectoral priorities in Argentina.
ARGENTINA CONSTRUCTION EQUIPMENT MARKET INDUSTRY RESTRAINTS
High Construction Costs
The National Institute of Statistics and Censuses (INDEC) reported that the Construction Cost Index (ICC) for Greater Buenos Aires rose 3.2% month-on-month in September 2025. The increase reflects uneven cost pressures across components: material prices advanced 2.9%, labour costs surged 3.7%, and overhead expenses grew 3.0%.
Argentina's construction sector is confronted with sustained inflationary pressures, volatile interest rates, escalating expenses for core building materials such as steel, cement, and aggregates, and monetary instability—all of which drive pressure on construction expenditures. This ongoing elevation in construction costs is anticipated to constrain construction equipment demand throughout the projected forecast period.
Decline in Government-Funded Infrastructure Projects
The scale of project interruption was substantial. The construction industry stated that approximately 3,500 public works initiatives were suspended between late 2023 and mid-2024. These stoppages, compounded by widespread delays in contractor payments, resulted in the elimination of nearly 100,000 jobs directly tied to construction.
Despite regulatory modernization efforts, the government has implemented contractual reforms intended to simplify public works procurement and attract both domestic and international construction firms. These regulatory modifications, however, stand in stark contrast to the practical reality of infrastructure stagnation.
Public investment reached historic lows in 2024, declining to levels unseen in over two decades. When adjusted for inflation, capital spending decreased 77.3% relative to 2023, representing an extraordinary cessation of public works accompanied by consequent infrastructure deterioration.
ARGENTINA CONSTRUCTION EQUIPMENT MARKET VENDOR LANDSCAPE
- Caterpillar, LiuGong, SANY, Bobcat, John Deere and XCMG are the front-runners in the country’s construction equipment market. These companies have strong market share and offer a diverse set of equipment in the Argentine market.
- Tadano, Terex, HELI, Zoomlion, Shantui, Kobelco, Wacker Neuson, Dingli, Yanmar, SDLG and Toyota Material Handling are niche market players in the market. These companies offer low product diversification and have strong presence in the Argentine market.
- LOVOL, Manitou, Komatsu, JCB, Hangcha, Michigan AR, Lonking, DEVELON, CNH Industrial NV, Volvo CE, Liebherr, and HD Hyundai Construction Equipment are emerging in the market. These companies are introducing new technologically advanced products to challenge the market share of market leaders in the Argentine market.
- Ammann, SAKAI, and Bomag have low product diversification; these companies are lagging in adopting new technologies used in construction equipment.
- John Deere has a presence in Argentina through its "Industria John Deere Argentina S.A." entity, which handles imported equipment, including compact construction machinery.
- LiuGong's operations in Argentina are structured around a strategic partnership with ZMG, which has served as the company's exclusive distributor since 2007 (17 years of partnership as of 2024). ZMG operates approximately 40 distributor points throughout Argentina and has established itself as a dominant player in the regional market.
- Caterpillar maintains a significant and established presence in the Argentina construction equipment market through its primary authorized dealer, Finning.
- Volvo Construction Equipment (Volvo CE) maintains a direct, company-owned dealer presence in Argentina through Escandinavia del Plata (EPSA), one of Volvo CE's owned dealer operations in the Americas region.
SNAPSHOT
The Argentina construction equipment market size by volume is expected to grow at a CAGR of approximately 4.01% from 2025 to 2031.
The following factors are likely to contribute to the growth of the Argentina construction equipment market during the forecast period:
- Booming Mining Sector to Propel the Demand for Construction Equipment
- Recovery of the Real Estate Sector
- Water & Road Infrastructure Modernization Initiatives by the Government
Base Year: 2025
Forecast Year: 2026-2031
The report considers the present scenario of the Argentina construction equipment market and its market dynamics for 2025−2030. It covers a detailed overview of several market growth enablers, restraints, and trends. The study covers both the demand and supply sides of the market. It also profiles and analyzes leading companies and several other prominent companies operating in the market.
Key Vendors
- John Deere
- LiuGong
- Caterpillar
- SANY
- XCMG
- Volvo CE
- Komatsu
- JCB
- Zoomlion
- HD Hyundai Construction Equipment
- Liebherr
Other Prominent Vendors
- BOMAG GmbH,
- Bobcat
- CNH Industrial N.V.
- Toyota Material Handling
- Develon
- Tadano
- Terex Corporation
- Manitou Group
- Zhejiang Dingli Machinery
- Lovol Heavy Industry
- Michigan
- Lonking Holdings Limited
- Hangcha Group
- Anhui Heli Co., Ltd.
- Kobelco
- Ammann
- Shantui Construction Machinery Co. Ltd.
- Wacker Neuson
- SAKAI Heavy Industries, Ltd.
- Shandong Lingong Construction Machinery Co., Ltd.
Distributor Profiles
- Grúas San Blas
- TECMACO Integral S.A.
- BRAMAQ S.R.L.
- COWDIN S.A.
- REPAS S.A.
- ZMG Argentina SRL
- Igarreta Máquinas S.A.
Segmentation by Type
Earthmoving Equipment
- Excavator
- Backhoe Loaders
- Wheeled Loaders
- Other Earthmoving Equipment (Other loaders, Bulldozers, Trenchers, Motor Graders)
Road Construction Equipment
- Road Rollers
- Asphalt Pavers
Material Handling Equipment
- Crane
- Forklift & Telescopic Handlers
- Aerial Platforms (Articulated Boom Lifts, Telescopic Boom lifts, Scissor lifts)
Other Construction Equipment
- Dumper
- Concrete Mixer
- Concrete Pump Truck
Segmentation by End Users
- Construction
- Mining
- Manufacturing
- Others (Power Generation, Utilities, Municipal Corporations, Oil & Gas, Cargo Handling, Power Generation Plants, Waste Management)
ARGENTINA CONSTRUCTION EQUIPMENT MARKET FAQs
How big is the Argentina construction equipment market?
Which are the major distributor companies in the Argentina construction equipment market?
What is the growth rate of Argentina construction equipment market?
Who are the key players in the Argentina construction equipment market?
What are the trends in the Argentina construction equipment market?
- GRAPH 1 TOTAL CONSTRUCTION EQUIPMENT IN 2024 (%)- BY EQUIPMENT TYPE
- GRAPH 2 IMPORT OF WHEELED LOADERS >1.7 TONS -AS OF MARCH 2025
- GRAPH 3 IMPORT OF SKID-STEER LOADERS-AS OF MARCH 2025
- GRAPH 4 IMPORT OF EXCAVATORS-AS OF MARCH 2025
- GRAPH 5 CONSTRUCTION EQUIPMENT MARKET, VOLUME (UNITS)
- GRAPH 6 CONSTRUCTION EQUIPMENT MARKET 2025 (%)
- GRAPH 7 EQUIPMENT TYPE (2025)
- GRAPH 8 END-USER (2025)
- GRAPH 9 ARGENTINA CONSTRUCTION EQUIPMENT MARKET, VOLUME 2022–2031 (UNITS)
- GRAPH 10 ARGENTINA CONSTRUCTION EQUIPMENT MARKET, VOLUME 2022–2031 ($ MN)
- GRAPH 11 ARGENTINA EARTHMOVING CONSTRUCTION EQUIPMENT MARKET 2022–2031 (UNITS)
- GRAPH 12 ARGENTINA EARTHMOVING CONSTRUCTION EQUIPMENT MARKET 2022–2031 ($ MN)
- GRAPH 13 ARGENTINA EXCAVATOR 2022–2031 (UNITS SALES)
- GRAPH 14 ARGENTINA EXCAVATOR MARKET 2022–2031 ($ MN)
- GRAPH 15 CONSTRUCTION EQUIPMENT IMPORTS-DEC 2024
- GRAPH 16 MOVING AND LIFTING EQUIPMENT IMPORTS-DEC 2024
- GRAPH 17 ORIGIN OF MINING EXPORTS BY PROVINCE ($MN) AND AS PERCENTAGE OF TOTAL EXPORTS
- GRAPH 18 ARGENTINA BACKHOE LOADERS MARKET 2022–2031 (UNITS)
- GRAPH 19 ARGENTINA BACKHOE LOADERS MARKET 2022–2031 ($ MN)
- GRAPH 20 ARGENTINA WHEELED LOADERS MARKET 2022–2031 (UNITS)
- GRAPH 21 ARGENTINA WHEELED LOADERS MARKET 2022–2031 ($ MN)
- GRAPH 22 ARGENTINA OTHER EARTHMOVING EQUIPMENT MARKET, 2022–2031 (UNITS)
- Graph 23 ARGENTINA OTHER EARTHMOVING EQUIPMENT MARKET 2022–2031 ($ MN)
- Graph 24 ARGENTINA ROAD CONSTRUCTION EQUIPMENT MARKET 2022–2031 (UNIT)
- Graph 25 ARGENTINA ROAD CONSTRUCTION EQUIPMENT MARKET 2022–2031 ($ MN)
- Graph 26 ARGENTINA ROAD ROLLERS MARKET, 2022–2031 (UNIT SALES)
- Graph 27 ARGENTINA ROAD ROLLERS MARKET, 2022–2031 ($ MN)
- Graph 28 ARGENTINA ASPHALT PAVERS MARKET 2022–2031 (UNITS)
- Graph 29 ARGENTINA ASPHALT PAVERS MARKET 2022–2031 ($ MN)
- Graph 30 ARGENTINA MATERIAL-HANDLING EQUIPMENT MARKET 2022–2031 (UNIT SALES)
- Graph 31 ARGENTINA MATERIAL-HANDLING EQUIPMENT MARKET 2022–2031 ($ MN)
- Graph 32 ARGENTINA CRANES MARKET, 2022–2031 (UNIT SALES)
- Graph 33 ARGENTINA CRANES MARKET 2022–2031 ($ MN)
- Graph 34 ARGENTINA FORKLIFTS AND TELESCOPIC HANDLERS MARKET 2022–2031 (UNIT SALES)
- Graph 35 ARGENTINA FORKLIFTS AND TELESCOPIC HANDLERS MARKET 2022–2031 ($ MN)
- Graph 36 ARGENTINA AERIAL PLATFORMS MARKET 2022–2031 (UNIT SALES)
- Graph 37 ARGENTINA AERIAL PLATFORMS MARKET 2022–2031 ($ MN)
- Graph 38 ARGENTINA OTHER CONSTRUCTION EQUIPMENT MARKET 2022–2031 (UNITS)
- Graph 39 ARGENTINA OTHER CONSTRUCTION EQUIPMENT MARKET 2022–2031 ($ MN)
- Graph 40 ARGENTINA DUMPERS MARKET 2022–2031 (UNITS)
- Graph 41 ARGENTINA DUMPERS MARKET 2022–2031 ($ MN)
- Graph 42 ARGENTINA CONCRETE MIXERS MARKET 2022–2031 (UNIT SALES)
- Graph 43 ARGENTINA CONCRETE MIXERS MARKET 2022–2031 ($ MN)
- Graph 44 ARGENTINA CONCRETE PUMP TRUCKS 2022–2031 (UNIT SALES)
- Graph 45 ARGENTINA CONCRETE PUMP TRUCKS 2022–2031 ($ MN)
- Graph 46 UTILIZATION OF CONSTRUCTION EQUIPMENT IN CONSTRUCTION INDUSTRY MARKET 2022–2031 (UNIT SALES)
- Graph 47 UTILIZATION OF CONSTRUCTION EQUIPMENT IN CONSTRUCTION INDUSTRY MARKET 2022–2031 ($ MN)
- Graph 48 UTILIZATION OF CONSTRUCTION EQUIPMENT IN MANUFACTURING INDUSTRY MARKET 2022–2031 (UNIT SALES)
- Graph 49 UTILIZATION OF CONSTRUCTION EQUIPMENT IN MANUFACTURING INDUSTRY MARKET 2022–2031 ($ MN)
- Graph 50 UTILIZATION OF CONSTRUCTION EQUIPMENT IN MINING INDUSTRY MARKET 2022–2031 (UNIT SALES)
- Graph 51 UTILIZATION OF CONSTRUCTION EQUIPMENT IN MINING INDUSTRY MARKET 2022–2031 ($ MN)
- Graph 52 UTILIZATION OF CONSTRUCTION EQUIPMENT IN OTHER END-USER INDUSTRIES MARKET 2022–2031 (UNIT SALES)
- Graph 53 UTILIZATION OF CONSTRUCTION EQUIPMENT IN OTHER END-USER INDUSTRIES MARKET 2022–2031 ($ MN)
- Graph 54 MARKET SHARE OF LEADING VENDORS VS OTHER VENDORS (2025)
- Graph 55 JOHN DEERE: SALES BY BUSINESS SEGMENT 2024 (%)
- Graph 56 CATERPILLAR: SALES BY REGION 2024 (%)
- Graph 57 CATERPILLAR: SALES BY BUSINESS SEGMENT 2024 (%)
- Graph 58 SANY: NET SALES 2020-2024 ($BN)
- Graph 59 XCMG: NET SALES 2020-2024 ($BN)
- Graph 60 VOLVO: NET SALES BY REGION 2024 (% SHARE)
- Graph 61 VOLVO: NET SALES BY SEGMENT 2024 (% SHARE)
- Graph 62 KOMATSU: SALES BY REGION IN 2024 (% SHARE)
- Graph 63 KOMATSU: BREAKDOWN OF NET SALES BY BUSINESS SEGMENT 2024 (% SHARE)
- Graph 64 JCB: NET SALES 2020- 2023 ($BN)
- Graph 65 ZOOMLION: NET SALES 2020- 2024 ($BN)
- Graph 66 LIEBHERR: SALES BY REGION 2024 (%SHARE)
- Graph 67 LIEBHERR: SALES BY SEGMENT 2024 (% SHARE)
List of Tables
- Table 1 POPULAR MODELS OF MINI EXCAVATORS IN ARGENTINA AS OF 2024 (BRAND WIDE)
- Table 2 KEY CONSTRUCTION PROJECTS DRIVING DEMAND FOR CONSTRUCTION EQUIPMENT IN ARGENTINA
- Table 3 RIGI MINING PROJECT SUMMARY AS OF 2024
- Table 4 HOUSING UNITS COMPLETED BY PROVINCE (2021–2025, ESTIMATED)
- Table 5 ARGENTINA CONSTRUCTION MATERIAL COSTS - NOVEMBER 2025
- Table 6 IMPORT DATA
- Table 7 TOTAL INCREMENTAL OPPORTUNITY 2025–2031 (EQUIPMENT TYPE)
- Table 8 TOTAL INCREMENTAL OPPORTUNITY 2025–2031 (END-USER)
- Section 1 – Research Methodology
- Section 2 – Research Objectives
- Section 3 – Research Process
- Section 4- Introduction
- 4.1 Market Coverage
- 4.2 Report Scope
- Section 5- Market at a Glance
- 5.1 Market Overview
- 5.2 Market Snapshot
- Section 6- Executive Summary
- Section 7- Market Landscape
- 7.1 PESTEL Analysis
- 7.2 Economic Scenario
- 7.3 Tariff Impact
- 7.4 Key Projects
- 7.5 Market Dynamics
- 7.6 Geographic Analysis
- 7.7 Import & Export Trend Analysis
- 7.8 Supply Chain Analysis
- Section 8- Segmentation
- 8.1 By Equipment Type
- 8.1.1 Equipment Definition (Earthmoving)
- 8.1.1.1 Earthmoving Equipment (Volume & Value)
- 8.1.1.2 Excavators
- 8.1.1.3 Backhoe Loaders
- 8.1.1.4 Wheeled Loaders
- 8.1.1.5 Other Earthmoving Equipment
- (Skid-steer Loaders, Bulldozers, Motor Graders)
- 8.1.2 Equipment Definition (Road Construction)
- 8.1.2.1 Road Construction (Volume & Value)
- 8.1.2.2 Road Rollers
- 8.1.2.3 Asphalt Pavers
- 8.1.3 Equipment Definition (Material Handling)
- 8.1.3.1 Material Handling Equipment (Volume & Value)
- 8.1.3.2 Cranes
- 8.1.3.3 Forklifts & Telehandlers
- 8.1.3.4 Aerial Platforms
- 8.1.4 Equipment Definition (Other Equipment)
- 8.1.4.1 Other Equipment (Volume & Value)
- 8.1.4.2 Dumpers
- 8.1.4.3 Concrete Mixers
- 8.1.4.4 Concrete Pump Trucks
- 8.2 By End-users
- 8.2.1 End-user Definition
- 8.2.2 Construction
- 8.2.3 Manufacturing
- 8.2.4 Mining
- 8.2.5 Others (Waste Management, Agriculture, Oil & Gas Extraction, Utilities & Energy, Power Generation, Disaster Management and Water Management)
- Section 9- Technological Development
- Section 10- Competitive Landscape
- 10.1 Competitive Landscape Overview
- 10.2 Prominent Vendors
- 10.3 Other Prominent Vendors
- 10.4 Distributor Profiles
- Section 11- Report Summary
- 11.1 Key Insights
- 11.2 Abbreviation
- 11.3 Exhibits
- 11.4 Related Report
- 11.5 Database
- 11.6 Global Reach
- 11.7 Offerings
Select a license type that suits your business needs
Single User Licence
- Report accessible by one user only
- Free 10% or 3 days of customization
- Free post-sale service assistance
- Continuous support through email
5 User Licence
- Report accessible by 5 users within the organization
- Free 15% or 4.5 days of customization
- Continuous support through email and telephone
- Free analyst hour
- Free Upgrade: If an updated report published within 180 days of purchase, you will get the revised report free of charge
Corporate Licence
- Free Datasheet worth $1500
- Report accessible by the entire organization
- Free 20% or 6 days of customization
- Free post-sale service assistance
- Continuous support through email and telephone
- Direct access to lead analysts
- Free analyst hour
- Free Upgrade: If an updated report published within 180 days of purchase, you will get the revised report free of charge
Datasheet Licence
- Report accessible by 1 user only
- Free 15% or 32 hours of customization
- Free post-sale service assistance
- Direct access to lead analysts
Frequently Asked Questions
How big is the Argentina construction equipment market?
Which are the major distributor companies in the Argentina construction equipment market?
What is the growth rate of Argentina construction equipment market?
Who are the key players in the Argentina construction equipment market?
What are the trends in the Argentina construction equipment market?
Other RELATED Reports
Southeast Asia Construction Equipment Market Research Report 2025-2030
Published : January 2026

U.S. Electric Construction Equipment Market - Strategic Assessment & Forecast 2025-2030
Published : March 2025