Australia Construction Equipment Market Report 2025-2030
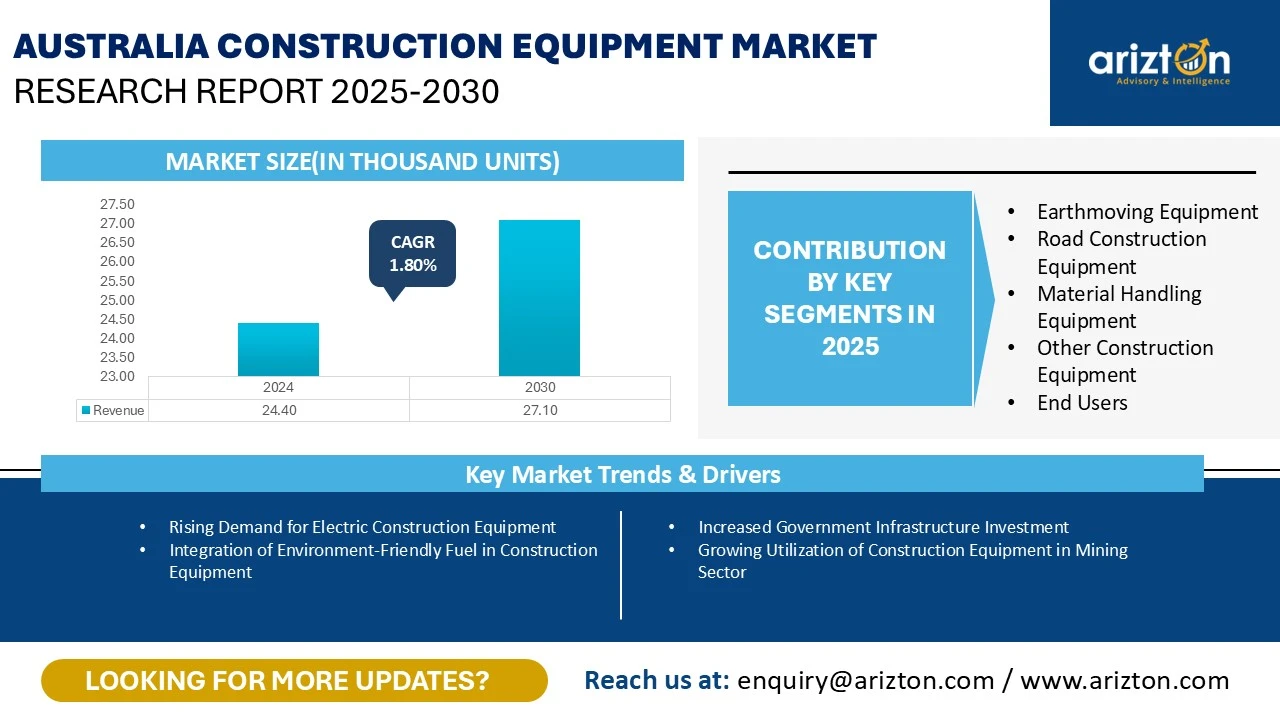
THE AUSTRALIA CONSTRUCTION EQUIPMENT MARKET SIZE WAS ESTIMATED AT 24.4 THOUSAND UNITS IN 2024 AND IS EXPECTED TO REACH 27.1 THOUSAND UNITS BY 2030, GROWING AT A CAGR OF 1.80%.

Australia Construction Equipment Market Size & Share By Earthmoving Equipment, By Road Construction Equipment, By Material Handling Equipment, By Other Equipment, By End Users. The Report Provides Sales Volume(Thousands of Units) and Revenue ($ MN)
Published Date : November 2025
Last Updated : January 2026
format: PDF
173 pages
11 tables
79 charts
37 company
05 segments
1 region
1 countries
Purchase Options
Australia Construction Equipment Market Report 2025-2030
THE AUSTRALIA CONSTRUCTION EQUIPMENT MARKET SIZE WAS ESTIMATED AT 24.4 THOUSAND UNITS IN 2024 AND IS EXPECTED TO REACH 27.1 THOUSAND UNITS BY 2030, GROWING AT A CAGR OF 1.80%.
Australia Construction Equipment Market Research Report Includes Segments By
- Earthmoving Equipment: Excavator, Backhoe Loaders, Wheeled Loaders, and Other Earthmoving Equipment (Other Loaders, Bulldozers, Trenchers, and Motor Graders)
- Road Construction Equipment: Road Rollers and Asphalt Pavers
- Material Handling Equipment: Crane, Forklift & Telescopic Handlers, and Aerial Platforms (Articulated Boom Lifts, Telescopic Boom lifts, and Scissor lifts)
- Other Construction Equipment: Dumper, Concrete Mixer, and Concrete Pump Truck
- End Users: Construction, Mining, Manufacturing, and Others
Industry Analysis Report, Regional Outlook, Growth Potential, Price Trends, Competitive Market Share & Forecast 2025–2030.
This report includes market data points, ranging from trend
analyses to market estimates & forecasts that you can customize
AUSTRALIA CONSTRUCTION EQUIPMENT MARKET REPORT x
| REPORT ATTRIBUTE | DETAILS |
|---|---|
| Market Size (2030) | 27.1 Thousand Units |
| Market Size (2024) | 24.4 Thousand Units |
| CAGR- VOLUME (2024-2030) | 24.4 Thousand Units |
| MARKET SIZE- REVENUE (2030) | USD 1.75 Billion |
| HISTORIC YEAR | 2021-2023 |
| BASE YEAR | 2024 |
| FORECAST YEAR | 2025-2030 |
| EQUIPMENT TYPE | Earthmoving Equipment, Road Construction Equipment, Material Handling Equipment, and Other Equipment |
| END USERS | Construction, Mining, Manufacturing, and Others |
| KEY VENDORS | Caterpillar, Komatsu, Volvo Construction Equipment, Hitachi Construction Machinery, Liebherr, SANY, Xuzhou Construction Machinery Group (XCMG), JCB, Kobelco, and Zoomlion |
AUSTRALIA CONSTRUCTION EQUIPMENT MARKET SIZE & INSIGHTS
The Australia construction equipment market size was estimated at 24.4 thousand units in 2024 and is expected to reach 27.1 thousand units by 2030, growing at a CAGR of 1.80% during the forecast period. Australia’s robust demand for construction equipment is driven by growing investment in the construction and tourism sectors, particularly in public infrastructure, including roads, railways, airports, and megaprojects. In addition, several government initiatives, such as the Infrastructure Investment Program, are supporting the growth of the construction industry.
Despite several challenges (skilled labour shortage, rising construction costs, and housing crisis) faced by Australia’s economy in 2025, the construction industry is expected to witness steady growth, encouraging demand for construction equipment over the forecast period.
KEY HIGHLIGHTS
- Earthmoving equipment accounted for the largest market share of the Australia construction equipment market in 2024. Excavators in the earthmoving segment accounted for the largest share in 2024. The country’s investment in developing its public infrastructure and increased utilization of excavators in the mining sector drive the Australian earthmoving market.
- On the other hand, demand for material handling equipment is also growing due to the booming manufacturing sector, driving the development of warehouses and logistics parks across the country.
- The forklifts and telescopic handler segment holds the largest share among material handling equipment in Australia, driven by ongoing and upcoming warehouse developments. A notable example is the recent approval of Bisinella Developments' major industrial warehouse project in Geelong, which is set to boost demand for these machines over the forecast year.
- Toyota Material Handling Australia (TMHA) unveiled 22 new electric-powered products—including four electric pneumatic counterbalance models (3,000–17,500 lb capacity)—at CeMAT Australia 2025, featuring Toyota’s Smart Environment Sensor (SEnS) pedestrian-detection system and System of Active Stability (SAS) safety technology.
- Maritime infrastructure development is generating significant demand for heavy-lift crawler cranes across Western Australia. The Western Australian Government's allocation of $134.5 million through the 2025–26 State Budget for port infrastructure enhancement will substantially increase crane utilization requirements.
- The road construction equipment segment is estimated to reach $102 million by value by 2030, growing at a CAGR of 1.34%.
- Road roller sales are high in Australia in response to the rising renovation and expansion of transport networks. The Western Australian Government is forging ahead with a new road infrastructure project, promising to deliver jobs and reduce motorists’ travel times. Worth more than $1 billion, the Tonkin Highway Extension and Thomas Road Upgrade project is one of the largest road transport infrastructure investments delivered to Perth’s south-east corridor.
- Construction equipment utilization in the construction industry by end-user (volume) has the largest market share in 2024.
- In 2025, construction hotspots in Australia include cities such as Sydney, Melbourne, and Brisbane, where urbanization and population growth drive demand for residential, commercial, and infrastructure projects.
- Melbourne is witnessing a surge in construction activity, with an emphasis on transport infrastructure and mixed-use developments. Infrastructure projects like the Sydney Metro and the West Gate Tunnel Project in Melbourne are leading the way. Brisbane, driven by preparations for the 2032 Olympics, is experiencing unprecedented growth, particularly in commercial and sporting facilities.
- The construction equipment used in the mining industry is undergoing significant expansion, primarily due to the growing mining and mineral extraction activities of the country. Key construction equipment used in the mining sector, such as hydraulic excavators, wheeled loaders, dump trucks, bulldozers, and motor graders, is expected to witness significant sales with rising mining activity in the country.
AUSTRALIA CONSTRUCTION EQUIPMENT MARKET TRENDS & DRIVERS
Rising Demand for Electric Construction Equipment
- Early in 2024, Liebherr-Australia commissioned its R 9400 E 400-tonne electric excavator at BHP’s Yandi iron-ore mine in the Pilbara (BHP’s first electric excavator worldwide) replacing a diesel unit with a zero-emissions alternative.
- Following this milestone, Liebherr secured multiple orders for electric excavators slated for delivery in 2024 and 2025, highlighting accelerating demand from major miners pursuing decarbonization
Integration of Environment-Friendly Fuel in Construction Equipment
- The Australian government has committed AUD$1.1 billion ($0.72 billion) over ten years beginning in 2028 to develop a domestic low-carbon fuels industry. This substantial investment targets biodiesel and sustainable aviation fuel production, positioning Australia as a major player in the global biofuels market while supporting construction equipment decarbonization.
- Leading construction equipment manufacturers have provided official approval for HVO100 renewable diesel use, ensuring warranty protection for fleet operators. Caterpillar, Volvo, and John Deere have all confirmed HVO100 compatibility across their modern engine ranges. John Deere has expanded biodiesel approval to B30 blends across all Tier 4 engines, increasing from the previous B20 approval.
Increased Government Infrastructure Investment
- In FY 2024–25, infrastructure allocations soared to a record $10.8 billion, representing 2.2% of total government expenditure, underscoring a steadfast commitment to project delivery despite broader fiscal constraints.
- Meanwhile, as part of the 2025–26 Budget, the Infrastructure Investment Program has been expanded to include 37 Corridor Packages—clusters of geographically aligned land-transport initiatives designed to streamline management and procurement.
- Additionally, in September 2025, the Western Australian and Australian governments officially commenced the Tonkin Highway Extension and Thomas Road Upgrade, a road infrastructure project valued at over $650 million that is expected to generate approximately 4,400 jobs for the state’s south-eastern corridor.
Growing Utilization of Construction Equipment in the Mining Sector
- In December 2024, the government committed AUD 75 million ($49.0 million) under the Future Made in Australia strategy to boost supplies of lithium, nickel and copper for renewable-energy applications—advancing decarbonization and strengthening the battery-technology supply chain.
- In April 2025, the Albanese Government unveiled a AUD 1.2 billion ($0.7 billion) Critical Minerals Strategic Reserve to accelerate domestic processing of 31 designated critical minerals, extend Australia’s position beyond raw-material exporter toward integrated value-chain producer and foster downstream manufacturing capabilities.
INDUSTRY RESTRAINTS
Skilled Labour Shortage
- Ongoing national labour shortages, highlighted by the Australian Bureau of Statistics data showing more than 325,000 vacancies for over four consecutive years—including 19,500 within construction—underscore that productivity is being restricted across states and territories.
- In regions like the Northern Territory, vacancy levels are nearly double pre-pandemic figures, further slowing project delivery and limiting investment activity.
- The shortage has led to widespread project delays, heightened safety concerns, worker fatigue, and infrastructure bottlenecks that intensify the national housing crisis.
Housing Crises in the Country
- The government’s National Housing Accord, which aims to deliver 1.2 million new homes between July 2024 and June 2029, now looks increasingly unattainable. Projections for 2025 indicate the country will fall approximately 262,000 homes short of this five-year target, a gap of 21.8%.
- Dwelling values climbed sharply over 2024, rising 4.9% across the year and a further 0.7% in the first quarter of 2025.
- Residential land transactions also stalled in 2024, remaining close to decade-low levels. The September quarter saw just 9,364 land sales nationally, a drop of 18.4% year-on-year, driven largely by a 27.3% decline in capital-city land transactions.
AUSTRALIA CONSTRUCTION EQUIPMENT MARKET VENDOR LANDSCAPE
- Caterpillar, Komatsu, Volvo CE, Hitachi Construction Machinery, Liebherr and XCMG are the front-runners in the country’s construction equipment market. These companies have strong market share and offer a diverse set of equipment in the Australian market.
- Tadano, John Deere, JCB, Kubota, Zoomlion, Kobelco, Shantui, Kato Works, and Toyota Material Handling are niche market players in the market. These companies offer low product diversification and have a strong presence in the country’s market.
- SANY, Manitou, HD Hyundai, Takeuchi, Sumitomo, CNH Industrials, Bobcat, DEVELON, and LiuGong are emerging in the market. These companies are introducing new technologically advanced products to challenge the market share of market leaders in the country’s market.
- Merlo SPA, JLG, Terex, Sakai, Yanmar, and Bomag have low product diversification; these companies are lagging in adopting new technologies used in construction equipment.
- In 2025, Komatsu launched the PC88MR-11 midi excavator in Australia for tight-access applications, including excavation, rock work and utilities projects.
- Volvo Construction Equipment launched six new excavator models in Australia in July 2025, including the EC210, EC220, EC230, EC260, EC300, and EC360. These models feature engine-pump optimisation technology delivering up to 15% greater fuel efficiency compared to previous models.
- National Diesel Dirt and Turf Expo (DTT) 2025, XCMG showcased a grand lineup of intelligent and green construction machinery tailored for the Australian market. The upgraded XC968-EV electric loader, XE215LC hybrid excavator, and XE19UE mini excavator were the main focus.
SNAPSHOT
Australia construction equipment market size by volume is expected to grow at a CAGR of approximately 1.80% from 2024 to 2030.
The following factors are likely to contribute to the growth of the Australia construction equipment market during the forecast period:
- Increased Government Infrastructure Investment
- Growing Utilization of Construction Equipment in Mining Sector
- Rising Development of Data Centers Across the Country
Base Year: 2024
Forecast Year: 2025-2030
The report considers the present scenario of the Australia construction equipment market and its market dynamics for 2025−2030. It covers a detailed overview of several market growth enablers, restraints, and trends. The study covers both the demand and supply sides of the market. It also profiles and analyzes leading companies and several other prominent companies operating in the market.
Prominent Vendors
- Caterpillar
- Komatsu
- Volvo Construction Equipment
- Hitachi Construction Machinery
- Liebherr
- SANY
- Xuzhou Construction Machinery Group (XCMG)
- JCB
- Kobelco
- Zoomlion
Other Prominent Vendors
- HD Hyundai Construction Equipment Co. Ltd.
- Liu Gong
- CNH Industrial N.V.
- Toyota Material Handling International (TMHI)
- Sumitomo Construction Machinery Co., Ltd.
- Yanmar Holdings Co., Ltd.
- DEVELON
- Tadano
- Terex Corporation
- Manitou Group
- BOMAG GmbH
- KATO WORKS CO., LTD.
- SAKAI Heavy Industries
- Takeuchi Manufacturing Co., Ltd.
- Merlo S.p.A.
- Bobcat
- Kubota
- JLG
- Shantui Construction Machinery Co., Ltd.
- John Deere
Distributor Profiles
- CJD Equipment
- Semco Equipment Sales
- Tutt Bryant Group
- Conplant
- Capital Construction Equipment
- BPF Equipment
- CEA (Construction Equipment Australia)
Segmentation by Type
Earthmoving Equipment
- Excavator
- Backhoe Loaders
- Wheeled Loaders
- Other Earthmoving Equipment (Other loaders, Bulldozers, Trenchers, Motor Graders)
Road Construction Equipment
- Road Rollers
- Asphalt Pavers
Material Handling Equipment
- Crane
- Forklift & Telescopic Handlers
- Aerial Platforms (Articulated Boom Lifts, Telescopic Boom lifts, Scissor lifts)
Other Construction Equipment
- Dumper
- Concrete Mixer
- Concrete Pump Truck
Segmentation by End Users
- Construction
- Mining
- Manufacturing
- Others (Power Generation, Utilities, Municipal Corporations, Oil & Gas, Cargo Handling, Power Generation Plants, Waste Management)
AUSTRALIA CONSTRUCTION EQUIPMENT MARKET FAQs
What is the growth rate of Australia construction equipment market?
How big is the Australia construction equipment market?
What are the trends in the Australia construction equipment market?
Who are the key players in the Australia construction equipment market?
Which are the major distributor companies in the Australia construction equipment market?
List of Exhibits
- Graph 1 CONSTRUCTION EQUIPMENT MARKET, VOLUME (UNITS)
- Graph 2 CONSTRUCTION EQUIPMENT MARKET 2024 (%)
- Graph 3 EQUIPMENT TYPE (2024)
- Graph 4 END-USER (2024)
- Graph 5 AUSTRALIA CONSTRUCTION EQUIPMENT MARKET, VOLUME 2021–2030 (UNITS)
- Graph 6 AUSTRALIA CONSTRUCTION EQUIPMENT MARKET, VOLUME 2021–2030 ($ MN)
- Graph 7 VICTORIA: TOTAL CONSTRUCTION SPENDING BY SECTORS IN 2024 (%)
- Graph 8 VICTORIA CONSTRUCTION EQUIPMENT MARKET 2021–2030 (UNITS)
- Graph 9 VICTORIA CONSTRUCTION EQUIPMENT MARKET BY SEGMENT 2021–2030 (UNITS)
- Graph 10 NEW SOUTH WALES: TOTAL CONSTRUCTION SPENDING BY SECTORS IN 2024 (%)
- Graph 11 NEW SOUTH WALES CONSTRUCTION EQUIPMENT MARKET 2021–2030 (UNITS)
- Graph 12 NEW SOUTH WALES CONSTRUCTION EQUIPMENT MARKET BY SEGMENT 2021–2030 (UNITS)
- Graph 13 SOUTH AUSTRALIA: TOTAL CONSTRUCTION SPENDING BY SECTORS IN 2024 (%)
- Graph 14 SOUTH AUSTRALIA CONSTRUCTION EQUIPMENT MARKET 2021–2030 (UNITS)
- Graph 15 SOUTH AUSTRALIA CONSTRUCTION EQUIPMENT MARKETBY SEGMENT 2021–2030 (UNITS)
- Graph 16 NORTHERN TERRITORY: TOTAL CONSTRUCTION SPENDING BY SECTORS IN 2024 (%)
- Graph 17 NORTHERN TERRITORY CONSTRUCTION EQUIPMENT MARKET 2021–2030 (UNITS)
- Graph 18 NORTHERN TERRITORY CONSTRUCTION EQUIPMENT MARKET BY SEGMENT 2021–2030 (UNITS)
- Graph 19 QUEENSLAND: TOTAL CONSTRUCTION SPENDING BY SECTORS IN 2024 (%)
- Graph 20 QUEENSLAND CONSTRUCTION EQUIPMENT MARKET 2021–2030 (UNITS)
- Graph 21 QUEENSLAND CONSTRUCTION EQUIPMENT MARKET BY SEGMENT 2021–2030 (UNITS)
- Graph 22 TASMANIA: TOTAL CONSTRUCTION SPENDING BY SECTORS IN 2024 (%)
- Graph 23 TASMANIA CONSTRUCTION EQUIPMENT MARKET 2021–2030 (UNITS)
- Graph 24 TASMANIA CONSTRUCTION EQUIPMENT MARKET BY SEGMENT 2021–2030 (UNITS)
- Graph 25 WESTERN AUSTRALIA: TOTAL CONSTRUCTION SPENDING BY SECTORS IN 2024 (%)
- Graph 26 WESTERN AUSTRALIA CONSTRUCTION EQUIPMENT MARKET 2021–2030 (UNITS)
- Graph 27 WESTERN AUSTRALIA CONSTRUCTION EQUIPMENT MARKET BY SEGMENT 2021–2030 (UNITS)
- Graph 28 AUSTRALIA EARTHMOVING CONSTRUCTION EQUIPMENT MARKET 2021–2030 (UNITS)
- Graph 29 AUSTRALIA EARTHMOVING CONSTRUCTION EQUIPMENT MARKET 2021–2030 ($ MN)
- Graph 30 AUSTRALIA EXCAVATOR 2021–2030 (UNITS SALES)
- Graph 31 AUSTRALIA EXCAVATOR MARKET 2021–2030 ($ MN)
- Graph 32 AUSTRALIA BACKHOE LOADERS MARKET 2021–2030 (UNITS)
- Graph 33 AUSTRALIA BACKHOE LOADERS MARKET 2021–2030 ($ MN)
- Graph 34 AUSTRALIA WHEELED LOADERS MARKET 2021–2030 (UNITS)
- Graph 35 AUSTRALIA WHEELED LOADERS MARKET 2021–2030 ($ MN)
- Graph 36 AUSTRALIA OTHER EARTHMOVING EQUIPMENT MARKET, 2021–2030 (UNITS)
- Graph 37 AUSTRALIA OTHER EARTHMOVING EQUIPMENT MARKET 2021–2030 ($ MN)
- Graph 38 AUSTRALIA ROAD CONSTRUCTION EQUIPMENT MARKET 2021–2030 (UNIT)
- Graph 39 AUSTRALIA ROAD CONSTRUCTION EQUIPMENT MARKET 2021–2030 ($ MN)
- Graph 40 AUSTRALIA ROAD ROLLERS MARKET, 2021–2030 (UNIT SALES)
- Graph 41 AUSTRALIA ROAD ROLLERS MARKET, 2021–2030 ($ MN)
- Graph 42 AUSTRALIA ASPHALT PAVERS MARKET 2021–2030 (UNITS)
- Graph 43 AUSTRALIA ASPHALT PAVERS MARKET 2021–2030 ($ MN)
- Graph 44 AUSTRALIA MATERIAL-HANDLING EQUIPMENT MARKET 2021–2030 (UNIT SALES)
- Graph 45 AUSTRALIA MATERIAL-HANDLING EQUIPMENT MARKET 2021–2030 ($ MN)
- Graph 46 AUSTRALIA CRANES MARKET, 2021–2030 (UNIT SALES)
- Graph 47 AUSTRALIA CRANES MARKET 2021–2030 ($ MN)
- Graph 48 AUSTRALIA FORKLIFTS AND TELESCOPIC HANDLERS MARKET 2021–2030 (UNIT SALES)
- Graph 49 AUSTRALIA FORKLIFTS AND TELESCOPIC HANDLERS MARKET 2021–2030 ($ MN)
- Graph 50 AUSTRALIA AERIAL PLATFORMS MARKET 2021–2030 (UNIT SALES)
- Graph 51 AUSTRALIA AERIAL PLATFORMS MARKET 2021–2030 ($ MN)
- Graph 52 AUSTRALIA OTHER CONSTRUCTION EQUIPMENT MARKET 2021–2030 (UNITS)
- Graph 53 AUSTRALIA OTHER CONSTRUCTION EQUIPMENT MARKET 2021–2030 ($ MN)
- Graph 54 AUSTRALIA DUMPERS MARKET 2021–2030 (UNITS)
- Graph 55 AUSTRALIA DUMPERS MARKET 2021–2030 ($ MN)
- Graph 56 AUSTRALIA CONCRETE MIXERS MARKET 2021–2030 (UNIT SALES)
- Graph 57 AUSTRALIA CONCRETE MIXERS MARKET 2021–2030 ($ MN)
- Graph 58 UTILIZATION OF CONSTRUCTION EQUIPMENT IN CONSTRUCTION INDUSTRY MARKET 2021–2030 (UNIT SALES)
- Graph 59 UTILIZATION OF CONSTRUCTION EQUIPMENT IN CONSTRUCTION INDUSTRY MARKET 2021–2030 ($ MN)
- Graph 60 UTILIZATION OF CONSTRUCTION EQUIPMENT IN MANUFACTURING INDUSTRY MARKET 2021–2030 (UNIT SALES)
- Graph 61 UTILIZATION OF CONSTRUCTION EQUIPMENT IN MANUFACTURING INDUSTRY MARKET 2021–2030 ($ MN)
- Graph 62 UTILIZATION OF CONSTRUCTION EQUIPMENT IN MINING INDUSTRY MARKET 2021–2030 (UNIT SALES)
- Graph 63 UTILIZATION OF CONSTRUCTION EQUIPMENT IN MINING INDUSTRY MARKET 2021–2030 ($ MN)
- Graph 64 UTILIZATION OF CONSTRUCTION EQUIPMENT IN OTHER END-USER INDUSTRIES MARKET 2021–2030 (UNIT SALES)
- Graph 65 UTILIZATION OF CONSTRUCTION EQUIPMENT IN OTHER END-USER INDUSTRIES MARKET 2021–2030 ($ MN)
- Graph 66 MARKET SHARE OF LEADING VENDORS VS OTHER VENDORS (2024)
- Graph 67 CATERPILLAR: SALES BY REGION 2024 (%)
- Graph 68 CATERPILLAR: SALES BY BUSINESS SEGMENT 2024 (%)
- Graph 69 KOMATSU: SALES BY REGION IN 2024 (% SHARE)
- Graph 70 KOMATSU: BREAKDOWN OF NET SALES BY BUSINESS SEGMENT 2024 (% SHARE)
- Graph 71 VOLVO: NET SALES BY REGION 2024 (% SHARE)
- Graph 72 VOLVO: NET SALES BY SEGMENT 2024 (% SHARE)
- Graph 73 HITACHI: SALES BY REGION 2024 (% SHARE)
- Graph 74 LIEBHERR: SALES BY REGION 2024 (%SHARE)
- Graph 75 LIEBHERR: SALES BY SEGMENT 2024 (% SHARE)
- Graph 76 SANY: NET SALES 2020-2024 ($BN)
- Graph 77 XCMG: NET SALES 2020-2024 ($BN)
- Graph 78 JCB: NET SALES 2020- 2023 ($BN)
- Graph 79 ZOOMLION: NET SALES 2020- 2024 ($BN)
List of Tables:
- Table 1 LIST OF MAJOR CONSTRUCTION PROJECTS IN NEW SOUTH WALES
- Table 2 LIST OF MAJOR CONSTRUCTION PROJECTS IN VICTORIA
- Table 3 LIST OF MAJOR CONSTRUCTION PROJECTS IN QUEENSLAND
- Table 4 LIST OF MAJOR CONSTRUCTION PROJECTS IN WESTERN AUSTRALIA
- Table 5 LIST OF MAJOR CONSTRUCTION PROJECTS IN SOUTHERN AUSTRALIA
- Table 6 LIST OF MAJOR CONSTRUCTION PROJECTS IN TASMANIA
- Table 7 BUILDING APPROVALS (AUGUST 2025)
- Table 8 IMPORT DATA
- Table 9 EXPORT DATA
- Table 10 TOTAL INCREMENTAL OPPORTUNITY 2024–2030 (EQUIPMENT TYPE)
- Table 11 TOTAL INCREMENTAL OPPORTUNITY 2024–2030 (END-USER)
- Section 1 – Research Methodology
- Section 2 – Research Objectives
- Section 3 – Research Process
- Section 4- Introduction
- 4.1 Market Coverage
- 4.2 Report Scope
- Section 5- Market at a Glance
- 5.1 Market Overview
- 5.2 Market Snapshot
- Section 6- Executive Summary
- Section 7- Market Landscape
- 7.1 PESTEL Analysis
- 7.2 Economic Scenario
- 7.3 Tariff Impact
- 7.4 Key Projects
- 7.5 Market Dynamics
- 7.6 Geographic Analysis
- 7.7 Import & Export Trend Analysis
- 7.8 Supply Chain Analysis
- Section 8- Segmentation
- 8.1 By Equipment Type
- 8.1.1 Equipment Definition (Earthmoving)
- 8.1.1.1 Earthmoving Equipment (Volume & Value)
- 8.1.1.2 Excavators
- 8.1.1.3 Backhoe Loaders
- 8.1.1.4 Wheeled Loaders
- 8.1.1.5 Other Earthmoving Equipment
- (Other Loaders, Bulldozers, Trenchers, etc.)
- 8.1.2 Equipment Definition (Road Construction)
- 8.1.2.1 Road Construction (Volume & Value)
- 8.1.2.2 Road Rollers
- 8.1.2.3 Asphalt Pavers
- 8.1.3 Equipment Definition (Material Handling)
- 8.1.3.1 Material Handling Equipment (Volume & Value)
- 8.1.3.2 Cranes
- 8.1.3.3 Forklifts & Telehandlers
- 8.1.3.4 Aerial Platforms
- 8.1.4 Equipment Definition (Other Equipment)
- 8.1.4.1 Other Equipment (Volume & Value)
- 8.1.4.2 Dumpers
- 8.1.4.3 Concrete Mixers/ Concrete Pump Trucks
- 8.2 By End-users
- 8.2.1 End-user Definition
- 8.2.2 Construction
- 8.2.3 Manufacturing
- 8.2.4 Mining
- 8.2.5 Others (Waste Management, Agriculture, Oil & Gas Extraction, Utilities & Energy, Power Generation, Disaster Management and Water Management)
- Section 9- Technological Development
- Section 10- Competitive Landscape
- 10.1 Competitive Landscape Overview
- 10.2 Prominent Vendors
- 10.3 Other Prominent Vendors
- 10.4 Distributor Profiles
- Section 11- Report Summary
- 11.1 Key Insights
- 11.2 Abbreviation
- 11.3 Exhibits
- 11.4 Related Report
- 11.5 Database
- 11.6 Global Reach
- 11.7 Offerings
Select a license type that suits your business needs
Single User Licence
- Report accessible by one user only
- Free 10% or 3 days of customization
- Free post-sale service assistance
- Continuous support through email
5 User Licence
- Report accessible by 5 users within the organization
- Free 15% or 4.5 days of customization
- Continuous support through email and telephone
- Free analyst hour
- Free Upgrade: If an updated report published within 180 days of purchase, you will get the revised report free of charge
Corporate Licence
- Free Datasheet worth $1500
- Report accessible by the entire organization
- Free 20% or 6 days of customization
- Free post-sale service assistance
- Continuous support through email and telephone
- Direct access to lead analysts
- Free analyst hour
- Free Upgrade: If an updated report published within 180 days of purchase, you will get the revised report free of charge
Datasheet Licence
- Report accessible by 1 user only
- Free 15% or 32 hours of customization
- Free post-sale service assistance
- Direct access to lead analysts
Frequently Asked Questions
What is the growth rate of Australia construction equipment market?
How big is the Australia construction equipment market?
What are the trends in the Australia construction equipment market?
Who are the key players in the Australia construction equipment market?
Which are the major distributor companies in the Australia construction equipment market?
Other RELATED Reports
Vietnam Construction Equipment Market - Strategic Assessment & Forecast 2025-2030
Published : July 2025