Indonesia Elevator and Escalator Market-Size & Growth Forecast 2026-2031
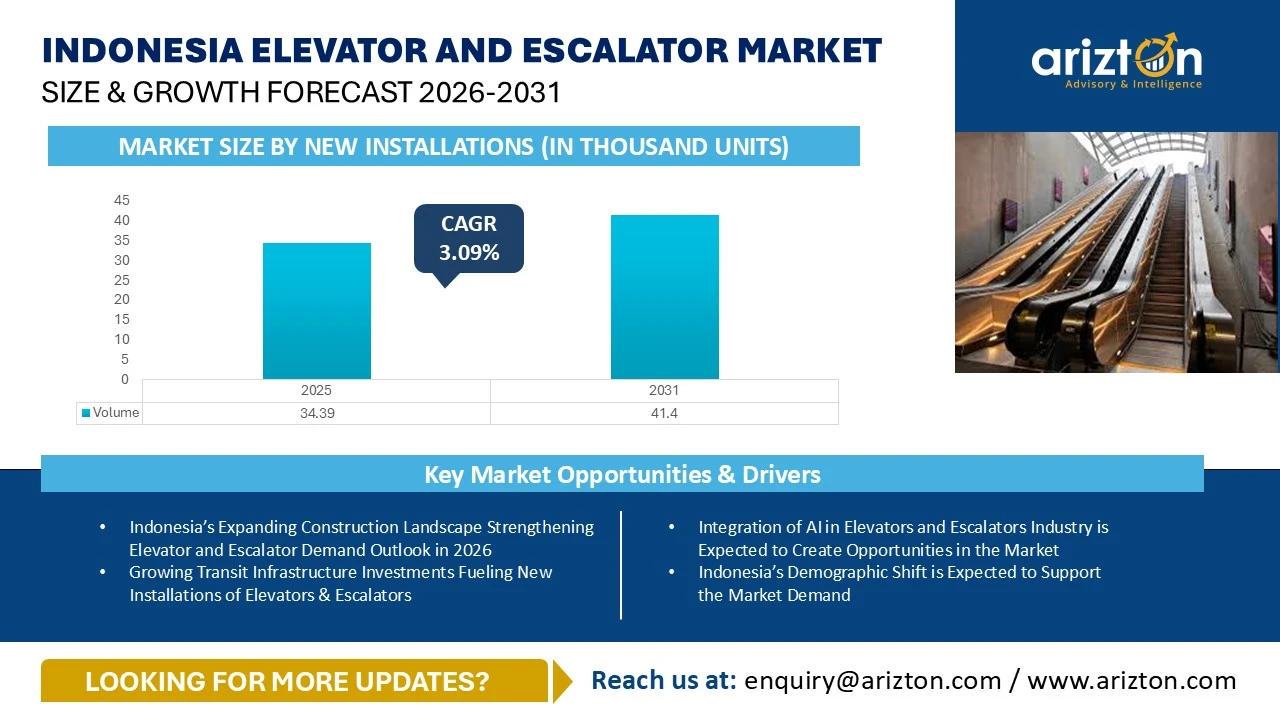
THE INDONESIA ELEVATOR AND ESCALATOR MARKET SIZE BY NEW INSTALLATIONS WAS VALUED AT 34.39 THOUSAND UNITS IN 2025 AND IS EXPECTED TO REACH 41.4 THOUSAND UNITS BY 2031, GROWING AT A CAGR OF 3.09% FROM 2025-2031.

124 pages
1 region
1 countries
18 company
06 segments
Purchase Options
Indonesia Elevator and Escalator Market-Size & Growth Forecast 2026-2031
THE INDONESIA ELEVATOR AND ESCALATOR MARKET SIZE BY NEW INSTALLATIONS WAS VALUED AT 34.39 THOUSAND UNITS IN 2025 AND IS EXPECTED TO REACH 41.4 THOUSAND UNITS BY 2031, GROWING AT A CAGR OF 3.09% FROM 2025-2031.
Indonesia Elevator and Escalator Market Size (Volume)
- Installation Base
- New Installation Type
- Modernization (In Million)
- Maintenance (In Million)
Indonesia Elevator Market Size (Volume)
- Installation Base
- New Installation Type
- Modernization & Maintenance (In Million)
Indonesia Escalator Market Size by Volume
- Installation Base
- New Installation Type
- Modernization & Maintenance (In Million)
Indonesia Elevator and Escalator Size, Share, & Trends Analysis Report by
Elevator Market Segmentation
- Machine Type: Hydraulic and Pneumatic, Machine Room Traction, Machine Room Less Traction, and Others (Climbing Elevators and Industrial Elevators)
- Carriage Type: Passenger and Freight
- Capacity: 2-15 Persons, 16-24 Persons, 25-33 Persons, and 34 Persons and Above
- End-User: Commercial, Residential, Industrial, and Others (Public Transit, Institutional, and Infrastructural)
Escalator Market Segmentation
- Product Type: Parallel, Multi Parallel, Moving Walkway, and Crisscross
- End-User: Public Transit, Commercial, and Others (Institutional Sector, Infrastructure & Industrial)
The Industry Analysis Report Provides Industry Trends, Drivers, Opportunities, Competitive Outlook, Industry Size, Sales, and Growth Forecast for 2026-2031
This report includes market data points, ranging from trend
analyses to market estimates & forecasts that you can customize
MALAYSIA ELEVATOR AND ESCALATOR MARKET REPORT SCOPE
| REPORT ATTRIBUTE | DETAILS |
|---|---|
| MARKET SIZE BY NEW INSTALLATIONS (2031) | 41.4 Thousand Units |
| MARKET SIZE BY NEW INSTALLATIONS (2025) | 34.39 Thousand Units |
| CAGR - NEW INSTALLATIONS (2025-2031) | 3.09% |
| MARKET SIZE BY INSTALLED BASE (2031) | 750.01 Thousand Units |
| MARKET SIZE BY MODERNIZATION (2031) | USD 150.62 Million |
| HISTORIC YEAR | 2022-2024 |
| BASE YEAR | 2025 |
| FORECAST YEAR | 2026-2031 |
| SEGMENTATION BY CARRIAGE TYPE | Passenger and Freight |
| SEGMENTATION BY CAPACITY | 2-15 Persons, 16-24 Persons, 25-33 Persons, and 34 Persons and Above |
| SEGMENTATION BY END-USER | Commercial, Residential, Industrial, and Others |
| SEGMENTATION BY MACHINE TYPE | Hydraulic and Pneumatic, Machine Room Traction, Machine Room Less Traction, and Others |
| KEY VENDORS | Otis, KONE, TK Elevator, Schindler, Mitsubishi Electric, Hyundai Elevator, Hitachi, and Fujitec |
INDONESIA ELEVATOR AND ESCALATOR MARKET SIZE & OVERVIEW
The Indonesia elevator and escalator market size by new installations was valued at 34.39 thousand units in 2025 and is expected to reach 41.4 thousand units by 2031, growing at a CAGR of 3.09% during the forecast period. Rise in urbanization and construction industry growth significantly contributes demand for elevators & escalators in the Indonesian market.
The real estate sector remains a core demand catalyst. The island of Java continues to dominate the national elevator and escalator market, accounting for approximately 70% of total demand, supported by concentrated economic activity and dense urban development in Jakarta and surrounding metropolitan areas
Additionally, the development of the new capital city, Nusantara (IKN), represents a significant long-term opportunity for vertical transportation suppliers.
The competitive landscape features a mix of leading multinational players and regional brands. Key global participants include Mitsubishi Electric (MJEE), KONE, Fujitec, Otis Worldwide Corporation, Schindler Group, TK Elevator, Hitachi, and Hyundai Elevator.
Indonesia imports elevators from at least 10 countries, including China, Japan, Sweden, South Korea, Germany, and Italy, among others. Among these suppliers, China remains the dominant source of elevator imports into Indonesia. Thailand is another notable supplier to the Indonesian market.
Despite of ongoing challenges (volatile exchange rates, rising construction costs and shortage of skilled technicians) the Indonesia’s elevator and escalator market is underpinned by structural urban growth, strong public and private investment pipelines, modernization demand, and accelerating adoption of smart, energy-efficient vertical transportation solutions.
MARKET DRIVERS & OPPORTUNITIES
Indonesia’s Expanding Construction Landscape Strengthening Elevator and Escalator Demand Outlook in 2026
- Indonesia’s construction sector remains a key driver of elevator and escalator demand, contributing over 10% to GDP in 2025. Growth continues into 2026, supported by public investment, private participation, and large-scale infrastructure projects.
- Stable economic conditions and government initiatives, including over 200 National Strategic Projects and Nusantara capital development, are boosting construction across sectors. Rising urbanization and a significant housing backlog are accelerating high-rise residential demand, while industrial expansion and foreign investment are driving need for freight and specialized lifts.
- Overall, sustained construction activity is fueling increased installations across residential, commercial, public, and industrial segments.
Growing Transit Infrastructure Investments Fueling New Installations of Elevators & Escalators
- Indonesia is advancing major urban rail projects that are driving demand for vertical transportation systems. The Jakarta East–West MRT corridor, a 24.5 km line with 21 stations, will require extensive escalators and elevators to manage high passenger volumes.
- The Greater Bandung LRT will enhance multimodal connectivity with elevated, high-capacity stations needing efficient vertical mobility solutions. Expansion of MRT stations in Tangerang will further increase demand for elevators and escalators across integrated transit networks.
- Meanwhile, the Surabaya Commuter Rail project, starting in 2029, supports broader rail modernization, improving connectivity and reinforcing long-term infrastructure-driven demand for vertical transport systems.
Integration of AI in Elevators and Escalators Industry is Expected to Create Opportunities in the Market
- The adoption of artificial intelligence (AI) is becoming a key growth driver for Indonesia’s elevator and escalator market, supporting urban development and smart-city initiatives in major cities.
- Global players such as KONE, Otis, Schindler, and Mitsubishi Electric are deploying AI-enabled, IoT-integrated systems that enable predictive maintenance, remote diagnostics, and traffic optimization.
- This is increasing demand for smart vertical transportation in premium residential, commercial, healthcare, and transit infrastructure.
- Innovations like Otis’ Gen3 Core and modernization solutions, along with KONE’s Renaissance program, highlight the shift toward digital, energy-efficient systems. Overall, AI integration is strengthening modernization demand and long-term service opportunities.
Indonesia’s Demographic Shift is Expected to Support the Market Demand
- Indonesia’s rapidly ageing population is becoming a key structural driver of elevator and escalator demand, as the share of elderly citizens is projected to rise from 11.93% in 2025 to 20.9% by 2050.
- This shift is increasing the need for barrier-free mobility across residential, healthcare, public, and commercial buildings, where elevators are now viewed as essential infrastructure rather than optional features.
- Accessibility regulations and inclusive design policies are further encouraging installations.
- Ageing demographics are also shaping transport infrastructure, with transit systems integrating vertical mobility solutions. Additionally, older equipment is being modernized or replaced to meet safety and accessibility standards, boosting long-term demand.
INDUSTRY RESTRAINTS
High Upfront Installation and Service Costs
- High installation and maintenance costs remain a major constraint on the adoption and modernization of elevators and escalators in Indonesia. Significant upfront expenses—driven by imported components, specialized construction, regulatory compliance, and skilled labour—make these systems less accessible, especially for smaller developers.
- Unit prices have remained high despite recent fluctuations, adding pressure to project budgets, particularly where multiple elevators are required. Ongoing costs for maintenance, repairs, and component replacement further strain building owners.
- Budget limitations in public infrastructure and delayed upgrades in older buildings highlight these challenges, ultimately slowing modernization and limiting the uptake of advanced, energy-efficient vertical transportation systems.
Exchange Rate Volatility and Rupiah Depreciation Constraining Elevator and Escalator Demand
- Volatility in the Indonesian rupiah is a key constraint on elevator and escalator demand, as the industry relies heavily on imported components priced in US dollars. Currency depreciation directly raises equipment and project costs, creating budget uncertainty for developers.
- In early 2026, the rupiah weakened significantly, continuing declines from 2025, which further increased import costs from major supplier countries such as China and Thailand.
- This has made projects more price-sensitive, prompting delays, phased installations, or a preference for basic maintenance over modernization.
- Additionally, higher costs of other imported construction materials compound financial pressures, weighing on short-term demand despite strong long-term growth fundamentals.
INDONESIA ELEVATOR AND ESCALATOR MARKET SEGMENTATION INSIGHTS
Elevator
- Machine-room-less (MRL) elevators accounted for one of the largest shares of the elevator market among the different machine types (hydraulic, pneumatic, machine room traction, and others), representing a major market share in total installations in 2025. The segment is expected to witness steady growth over the forecast period, with new installations expanding at a CAGR of 3.33%.
- MonoSpace DX machine room-less elevator from KONE is a machine room-less elevator for mid-rise and low-rise buildings with connectivity, improved people flow, and an inspiring elevator experience. Powered by the compact, energy-efficient KONE EcoDisc hoisting motor, the KONE MonoSpace DX is eco-friendly, and it saves valuable space in a building by completely removing the need for a machine room.
- TK Elevator's meta and enta series (MRL) are ideal for residential buildings and mixed-use buildings with up to 120m height. The enta series is designed to transport a larger number of passengers (max capacity: 5,000kg) to high-traffic buildings. It is well suited to be used in mass-transit hubs such as metro stations, airports and malls. The meta series on the other has a lower maximum capacity (1,632kg) but comes with a variety of cabin customization options. It is therefore ideally suited for use in the hospitality sector, or in upscale apartment buildings.
- In the carriage type segment, passenger elevators accounted for the largest Indonesia elevator and escalator market share, of total installations in 2025. This dominance is primarily attributed to the high demand for vertical transportation in residential, commercial, and mixed-use buildings, where passenger mobility remains the primary requirement.
- By 2026, around 60% of the population is expected to live in urban areas, accelerating the construction of high-rise and multi-storey housing, where at least one passenger elevator is typically required.
- This urban shift is concentrating people and employment in dense metropolitan areas, making mid- and high-rise residential and mixed-use buildings increasingly common and structurally dependent on passenger elevators. At the same time, the continued development of IKN Nusantara and other major infrastructure and urban clusters is stimulating demand for apartment towers, offices, hotels, hospitals, and mixed-use complexes, each requiring multiple elevator systems.
- In the capacity (person) segment, 2–15 person elevators recorded the largest incremental growth in new installations during the 2025–2031 period, recording a CAGR of 3,25%. This growth is primarily driven by their widespread application in residential buildings, mid-rise commercial properties, and mixed-use developments, where moderate passenger capacity is sufficient to meet daily traffic requirements.
- The rapid development of Indonesia’s new Capital City (IKN) is beginning to significantly reshape population distribution and housing demand in surrounding buffer cities in 2026. Increasing migration from Java and other major urban centers to Balikpapan is prompting property developers to accelerate new projects. In response, PAM Group, through its subsidiary PT Fajar Sinar Teguh, has officially commenced construction of a low-rise apartment development known as Sepinggan Terrace in 2026.
- In the elevator end-user segment, residential elevators recorded the largest volume of new installations in 2025. This dominance is primarily driven by the rapid development of high-rise residential buildings, apartment complexes, and urban housing projects, particularly in densely populated urban areas where vertical transportation is essential.
- In 2026, the strategic collaboration between the Indonesian Chamber of Commerce and Industry (Kadin) and Perumnas to accelerate affordable and sustainable housing delivery is expected to translate directly into higher demand for residential elevators across Indonesia.
- The government’s allocation of up to $7.7 billion for the Housing Credit Program (KPP) in 2026 will further stimulate home purchases, construction, and renovation activity nationwide. With housing credit disbursement targeted at $1.7 billion in Q1 2026 alone, developers are likely to fast-track new residential projects, particularly in urban and peri-urban areas where land constraints encourage vertical expansion. This shift toward mid-rise and higher-density housing configurations is expected to boost installations of 2–15-person capacity residential elevators.
Escalator
- In the product type segment, parallel escalators recorded the largest volume of new installations. The segment is also expected to experience the highest incremental growth during the 2025–2031 period.
- Jakarta is seeing new mixed‑use lifestyle centers such as Menara Jakarta in Kemayoran, where The Mall at Menara Jakarta is a six‑storey, 33,800 m² shopping mall designed as a modern lifestyle hub, implying extensive vertical circulation via escalators and elevators across multiple levels. This type of large, multi‑floor mall layout is typically served by parallel escalators.
- Existing malls are also upgrading Millennium Mall in central Jakarta (formerly Plaza Atrium) contracted Otis Indonesia to modernize 39 vertical‑transport units, including replacing 25 escalators and refurbishing six more, mainly in high‑traffic areas in 2025.
- By the escalator end-user segment, commercial escalators recorded the largest volume of new installations. They are widely used across shopping malls, department stores, airports and transit hubs, hotels, convention centers, office towers, and integrated mixed-use projects.
- By Q1 2025, Jakarta’s total mall stock had reached approximately 4.9 million square metres following the opening of Agora Lifestyle Thamrin. Further additions, including Lippo Mall East Side and the retail podium at Menara Jakarta, are scheduled for completion in 2026. These developments will depend heavily on escalators to manage vertical passenger movement across multiple floors.
VENDOR LANDSCAPE
Otis Worldwide Corporation, KONE Corporation, Mitsubishi Electric Corporation, Schindler Group, Hitachi Ltd., and Fujitec Co., Ltd. constitute the top six vendors in the Indonesian elevator and escalator market.
Collectively, these companies account for an estimated over 75% of total market value, highlighting a moderately concentrated competitive structure. The remaining market share is distributed among regional and local manufacturers, as well as smaller international brands, reflecting a fragmented competitive fringe.
Among the leading players, Schindler and KONE holds a strong individual position, with an estimated value share of around 15% each. While this places the company in a leadership position, the margin over its closest competitors remains relatively narrow. Mitsubishi Electric, OTIS, and Hitachi, follow closely, indicating strong competitive intensity among the top three vendors, particularly in mid- to high-rise commercial and residential segments.
Fujitec, represent a well-established second tier of multinational OEMs. The proportion attributed to “Other Vendors” suggests a growing presence of Chinese manufacturers.
These players are particularly active in price-sensitive low- to mid-rise residential developments and smaller commercial projects, where cost competitiveness tends to outweigh advanced feature requirements.
SNAPSHOT
The Indonesia elevator and escalator market size by new installations was valued at 34.39 thousand units in 2025 and is expected to reach 41.4 thousand units by 2031, growing at a CAGR of 3.09% during the forecast period.
The following factors are likely to contribute to the growth of the Indonesia elevator and escalator market during the forecast period:
- Indonesia’s Expanding Construction Landscape Strengthening Elevator and Escalator Demand Outlook in 2026
- Data Center Expansion in Indonesia to Propel the Installations of Freight Elevators
- Growing Transit Infrastructure Investments Fueling New Installations of Elevators & Escalators
Base Year: 2025
Forecast Year: 2026-2031
The report considers the present Indonesia elevator and escalator market scenario and market dynamics from 2026 to 2031. It covers a detailed overview of several market growth enablers, restraints, and trends. The study includes the volume and value sales with a segment analysis of the Thailand elevator and escalator market.
Key Vendors
- Otis
- KONE
- TK Elevator
- Schindler
- Mitsubishi Electric
- Hyundai Elevator
- Hitachi
- Fujitec
Other Prominent Vendors
- Cibes Lift AB
- Toshiba Elevator and Building Systems Corporation
- Canny Elevator Co., Ltd.
- IFE Elevators Co., Ltd.
- Sigma Elevators
- Sicher Elevator Co., Ltd.
- BLT-Brilliant (Shenyang Brilliant Elevator Co., Ltd.)
- Tokyo Elevator Co., Ltd.
- Fuji Hengda Elevator
- SJEC Corporation
Elevator Market Segmentation by
Machine Type
- Hydraulic and Pneumatic
- Machine Room Traction
- Machine Room Less Traction
- Others
- Climbing
- Elevators
- Industrial Elevators
Carriage Type
- Passenger
- Freight
Capacity
- 2-15 Persons
- 16-24 Persons
- 25-33 Persons
- 34 Persons and Above
End-User
- Commercial
- Residential
- Industrial
- Others
- Public Transit
- Institutional
- Infrastructural
Escalator Market Segmentation by
Product Type
- Parallel
- Multi Parallel
- Walkway
- Crisscross
End-User
- Public Transit
- Commercial
- Others
- Institutional Sector
- Infrastructure
- Industrial
INDONESIA ELEVATOR AND ESCALATOR MARKET FAQs
How big is the Indonesia elevator and escalator market?
What will be the growth rate of the Indonesia elevator and escalator market?
What are the key Indonesia elevator and escalator market players?
What is the number of installed bases in the Indonesia elevator and escalator market in 2031?
What are the key opportunities in the Indonesia elevator and escalator market?
For more details, please reach us at [email protected]
1. Market Scope
2. Executive Summary
3. Introduction
4. Elevators Market in Indonesia
5. Escalators Market in the Indonesia
6. Elevators and Escalators Market – By Service (Maintenance & Modernization)
7. Geographic Analysis
8. Market Dynamics – Market Opportunities, Drivers & Restraints
9. Technological Development
10. Competitive Landscape
11. Report Summary
12. Appendix (Definition, Inclusions & Exclusions)
Select a license type that suits your business needs
Single User Licence
- Report accessible by one user only
- Free 10% or 3 days of customization
- Free post-sale service assistance
- Continuous support through email
5 User Licence
- Report accessible by 5 users within the organization
- Free 15% or 4.5 days of customization
- Continuous support through email and telephone
- Free analyst hour
- Free Upgrade: If an updated report published within 180 days of purchase, you will get the revised report free of charge
Corporate Licence
- Free Datasheet worth $1500
- Report accessible by the entire organization
- Free 20% or 6 days of customization
- Free post-sale service assistance
- Continuous support through email and telephone
- Direct access to lead analysts
- Free analyst hour
- Free Upgrade: If an updated report published within 180 days of purchase, you will get the revised report free of charge
Datasheet Licence
- Report accessible by 1 user only
- Free 15% or 32 hours of customization
- Free post-sale service assistance
- Direct access to lead analysts
Frequently Asked Questions
How big is the Indonesia elevator and escalator market?
What will be the growth rate of the Indonesia elevator and escalator market?
What are the key Indonesia elevator and escalator market players?
What is the number of installed bases in the Indonesia elevator and escalator market in 2031?
What are the key opportunities in the Indonesia elevator and escalator market?
Other RELATED Reports
Thailand Elevator and Escalator Market - Size & Growth Forecast 2026-2031
Published : April 2026

Philippines Elevator and Escalator Market Size & Growth Forecast 2025-2030
Published : March 2025
Southeast Asia Elevator and Escalator Market - Size & Growth Forecast 2025-2030
Published : March 2025

Singapore Elevator and Escalator Market Size & Growth Forecast 2025-2030
Published : March 2025