Netherlands Construction Equipment Market Research Report 2026-2031
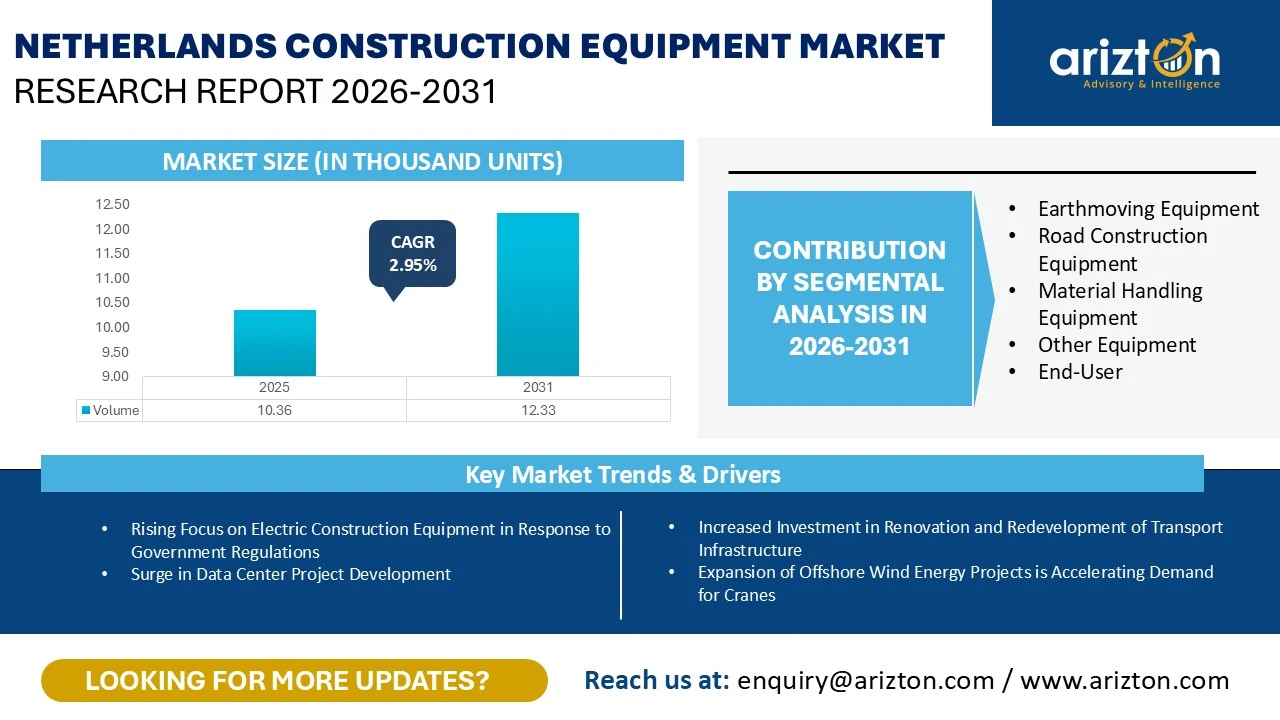
THE NETHERLANDS CONSTRUCTION EQUIPMENT MARKET SIZE WAS ESTIMATED AT 10.36 THOUSAND UNITS IN 2025 AND IS EXPECTED TO REACH 12.33 THOUSAND UNITS BY 2031, GROWING AT A CAGR OF 2.95%

Netherlands Construction Equipment Market Size & Share By Earthmoving Equipment, By Road Construction Equipment, By Material Handling Equipment, By Other Equipment, By End Users. The Report Provides Sales Volume in Thousands of Units and Revenue in USD Mi
Published Date : February 2026
Last Updated : February 2026
format: PDF
edition : Third Edition
168 pages
09 tables
62 charts
1 region
1 countries
35 company
05 segments
Purchase Options
Netherlands Construction Equipment Market Research Report 2026-2031
THE NETHERLANDS CONSTRUCTION EQUIPMENT MARKET SIZE WAS ESTIMATED AT 10.36 THOUSAND UNITS IN 2025 AND IS EXPECTED TO REACH 12.33 THOUSAND UNITS BY 2031, GROWING AT A CAGR OF 2.95%
The Netherlands Construction Equipment Market Research Report Includes Segments By
- Earthmoving Equipment: Excavator, Backhoe Loaders, Wheeled Loaders, and Other Earthmoving Equipment (Other Loaders, Bulldozers, Trenchers, and Motor Graders)
- Road Construction Equipment: Road Rollers and Asphalt Pavers
- Material Handling Equipment: Crane, Forklift & Telescopic Handlers, and Aerial Platforms (Articulated Boom Lifts, Telescopic Boom lifts, and Scissor lifts)
- Other Construction Equipment: Dumper, Concrete Mixer, and Concrete Pump Truck
- End Users: Construction, Mining, Manufacturing, and Other End Users
Industry Analysis Report, Regional Outlook, Growth Potential, Price Trends, Competitive Market Share & Forecast 2026–2031.
This report includes market data points, ranging from trend
analyses to market estimates & forecasts that you can customize
NETHERLANDS CONSTRUCTION EQUIPMENT MARKET REPORT SCOPE
| REPORT ATTRIBUTE | DETAILS |
|---|---|
| MARKET SIZE- VOLUME (2031) | 12.33 Thousand Units |
| MARKET SIZE- VOLUME (2025) | 10.36 Thousand Units |
| CAGR- VOLUME (2025-2031) | 2.95% |
| MARKET SIZE- REVENUE (2031) | USD 842.7 Million |
| HISTORIC YEAR | 2022-2024 |
| BASE YEAR | 2025 |
| FORECAST YEAR | 2026-2031 |
| EQUIPMENT TYPE | Earthmoving Equipment, Road Construction Equipment, Material Handling Equipment, and Other Equipment |
| END-USERS | Construction, Mining, Manufacturing, and Others |
| KEY VENDORS | Caterpillar, Volvo CE, Komatsu, Hitachi Construction Machinery, Liebherr, JCB, LiuGong, SANY, XCMG, Kobelco, Zoomlion, HD Hyundai Construction Equipment, CNH Industrial, and Kubota Corporation |
NETHERLANDS CONSTRUCTION EQUIPMENT MARKET SIZE
The Netherlands construction equipment market size was estimated at 10.36 thousand units in 2025 and is expected to reach 12.33 thousand units by 2031, growing at a CAGR of 2.95% during the forecast period. The market in 2026 reflects optimism, with a moderate recovery supported by activity in non-residential construction, manufacturing, transport infrastructure, and a gradual rebound in housing. This momentum is boosted by European Union (EU) funding directed toward sustainability and green transition projects.
The Netherlands construction equipment market in 2025 was underpinned by structurally strong demand from the housing shortage, infrastructure renewal, and the energy transition, but faces notable near-term headwinds from regulatory uncertainty, electricity grid congestion, and weak construction output.
KEY HIGHLIGHTS
- Earthmoving equipment accounted for the largest market share of the Netherland construction equipment market in 2025. Excavators in the earthmoving segment accounted for the largest share in 2025. The Dutch earthmoving equipment market in 2025 is being driven by several factors rooted in government-mandated economic transformation, including an acute housing crisis that requires unprecedented construction activity, a critical electricity grid expansion program, aggressive deployment of renewable energy infrastructure, comprehensive modernization of flood management, and broad-based rehabilitation of transport infrastructure.
- Conversely, demand for material handling equipment is rising in tandem with port expansion and logistics activity. Capacity upgrades to accommodate higher cargo volumes, enhance operational efficiency, and attract international trade are directly translating into increased demand for material handling equipment.
- In December 2025, Mammoet took delivery of the new Liebherr LTM 1150-5.4E mobile crane featuring a battery-electric drive. While prototype testing remains ongoing at Liebherr’s Ehingen facility, the crane has entered practical field testing with Mammoet, supporting the company’s sustainability objectives. Liebherr has announced that series production and broader market delivery of the LTM 1150-5.4E are scheduled to commence in spring 2026.
- Accelerated offshore wind energy expansion represents a critical demand driver for cranes in the Netherlands. The most significant driver of crane demand in the Netherlands is the government's ambitious expansion of offshore wind capacity.
- The road construction equipment segment is estimated to reach $35.8 million by value by 2031, growing at a CAGR of 2.82%.
- The largest government investment in Gelderland in 2025 is the ViA15 motorway project, which reached financial close in December. Valued at $1.64 billion, the project includes widening 11 km of the A15, upgrading 12 km of the A12, and building a new 12 km A15 extension with a 2.5 km bridge over the Pannerdensch Canal to improve regional connectivity in the Arnhem–Nijmegen area.
- The A16 Rotterdam maintenance and expansion program—covering a key European freight corridor connecting Belgium to the Port of Rotterdam—has involved extensive asphalt resurfacing works between the Terbregseplein and Ridderkerk junctions. The renewal of approximately 3 kilometers of roadway, alongside the replacement of 46 expansion joints spanning a combined 800 meters, has generated sustained demand for tandem and pneumatic road rollers throughout late 2025, with compaction requirements extending into May 2026.
- The government’s long-term commitment to maintaining and expanding approximately 37,000 kilometres of dedicated cycling infrastructure—supported by an annual maintenance budget of about $703.2 million and an additional $1.1 billion in capital spending for cycling routes is generating demand for technologically integrated asphalt pavers.
- Construction equipment utilization in the construction industry by end-user (volume) has the largest market share in 2025.
- According to Statistics Netherlands (CBS), construction output is now expected to grow by 1.0% in 2025, representing a moderate expansion but a clear upward revision from the previous 0.3% forecast.
- Despite this improvement, underlying sector conditions remain broadly unchanged. Nitrogen-related permitting constraints and labour shortages continue to limit capacity, while a negative impact is anticipated in 2026 due to the decline in building permits issued in late 2024 and early 2025.
- Netherlands is experiencing transformative growth in renewable energy project development during 2025, driven by ambitious government targets and substantial investment commitments. Renewable energy projects in the Netherlands experienced significant growth in 2025, with solar capacity additions projected at 4.7 GW and offshore wind advancing toward 21 GW targets despite some delays.
- Solar installations are forecast to add 4.7 GW in 2025, pushing cumulative capacity to 33.3 GW, supported by SDE++ subsidies allocating nearly 1.8 GW in recent rounds. Offshore wind capacity exceeded 4.7 GW by end-2023, with ongoing construction in zones like Hollandse Kust Noord and IJmuiden Ver, though tenders faced delays due to costs.
NETHERLANDS CONSTRUCTION EQUIPMENT MARKET DRIVERS
Increased Investment in Renovation and Redevelopment of Transport Infrastructure
Construction equipment demand in the Netherlands is being supported by sustained public investment in transport infrastructure in 2025. Transport construction remains a central pillar of national economic development, underpinned by urban expansion, decarbonization objectives, and the modernization of mobility networks.
Under the road infrastructure expansion and motorway modernization, in December 2025, the European Investment Bank signed a $587.4 million financing agreement with the GelreGroen consortium for the completion and upgrading of the A12/A15 motorway corridor in eastern Netherlands.
Rail infrastructure investment represents another significant demand driver. ProRail has outlined a long-term transformation programme through 2030 focused on network modernization, digital signalling, and station redevelopment.
Expansion of Offshore Wind Energy Projects is Accelerating Demand for Cranes
Offshore wind energy is a key part of the Netherlands’ move toward cleaner and more secure energy. By producing more renewable power domestically, the country can rely less on imported energy.
Reflecting the strategic importance of offshore wind, the previous Dutch government doubled its deployment ambition to approximately 21 GW of installed offshore wind capacity by 2032. This commitment has been reaffirmed by the current government, which has confirmed full implementation of the Offshore Wind Energy Roadmap.
In addition, to avoid a slowdown in offshore wind projects in the near term, the government has introduced focused support measures under its 2025 Offshore Wind Energy Action Plan.
Together, the $1.3 billion Offshore Wind Energy Action Plan announced in September 2025 plays a key role in keeping offshore wind projects moving forward despite rising construction and financing costs
NETHERLANDS CONSTRUCTION EQUIPMENT MARKET TRENDS
Rising Focus on Electric Construction Equipment in Response to Government Regulations
Growing demand for electric construction equipment in the Netherlands in 2025 is reshaping the machinery market and accelerating the shift toward compact, battery-powered solutions. This trend is being driven by rapid urbanization, tighter sustainability requirements, and robust infrastructure spending, encouraging contractors, rental companies, and public-sector purchasers to transition to more energy-efficient and environmentally sustainable equipment.
Policy support plays a central role in accelerating this transition. The Netherlands operates one of Europe’s most expansive subsidy frameworks dedicated specifically to construction equipment electrification through the SSEB (Schoon en Emissieloos Bouwmaterieel) scheme, which runs until the end of 2026.
This policy framework aligns with the Netherlands’ climate targets of cutting emissions by 55% by 2030 and reaching climate neutrality by 2050, with the Climate Act, Climate Agreement, and Clean Air Agreement jointly enforcing strict limits on nitrogen and reduce emissions from construction activities.
Surge in Data Center Project Development
Data center construction has emerged as one of the most rapidly expanding segments of the Dutch construction sector in 2025, with measurable implications for construction equipment demand. This expansion is being driven by rising requirements for AI-related computing capacity, spatial planning and zoning policies that concentrate new developments in a limited number of designated areas, and the need to deliver projects within tight timelines despite significant grid congestion.
Major hyperscale investments are anchoring this construction upswing. The commissioning of a new hyperscale facility by Google in Winschoten, Groningen, in late 2025 represents the largest completed data-center project in the country this year and highlights the Netherlands’ role in global AI and cloud infrastructure networks.
INDUSTRY RESTRAINTS
Nitrogen Crises Impacting the Dutch Construction Sector
- In 2025, the nitrogen crisis continues to constrain construction equipment sales in the Netherlands by limiting the number of projects that progress from planning to execution.
- The impact on the equipment market is amplified by the reduction in the pool of permitted projects. Analysis of nitrogen-sensitive protected areas against current housing development plans indicates that approximately 244,000 homes planned by 2030 face a high risk of delay or cancellation because they are located too close to such areas.
- Nitrogen-related permitting constraints on residential and commercial construction are expected to result in more than $110 billion in foregone investment over the next five years, before accounting for infrastructure impacts.
- Unless nitrogen emissions are reduced enough to allow permits to be granted, the nitrogen crisis will continue to limit construction output and structurally constrain construction equipment sales in the Netherlands, irrespective of housing demand pressures or stated government investment plans.
Rise in Construction Cost
- In 2025, rising construction costs in the Netherlands are acting as a structural constraint on demand for construction equipment, even as construction activity shows a modest recovery. With construction output projected to expand by only 1.5%–1.7% after a sharp contraction in 2024, cost pressures are forcing contractors to optimize their investment in construction equipment.
- Unlike the rise in building material prices in 2022–2023, the current cost environment is driven mainly by acute labour shortages and stricter regulatory requirements, particularly related to nitrogen emissions and energy performance. These factors increase project complexity and overheads without proportionally increasing build volumes, limiting the new equipment purchases.
- Under these conditions, contractors and rental companies tend to delay fleet renewal, extend the operating life of existing machines, or rely more heavily on rentals, dampening overall new construction equipment demand.
VENDOR LANDSCAPE
- Caterpillar, Komatsu, Hitachi Construction Machinery, Volvo CE, and Liebherr are the front-runners in the country’s construction equipment market. These companies have strong market share and offer a diverse set of equipment in the Dutch market.
- Tadano, Terex, HELI, Bobcat, Shantui DEVELON, Wacker Neuson, Mnaitou, Hangcha, Toyota Material Handling, and Yanmar are niche market players in the market. These companies offer low product diversification and have a strong presence in the Dutch market.
- SANY, JCB, LiuGong, XCMG, Kobelco, Kubota, Zoomlion, Takeuchi, CNH Industrial NV, and HD Hyundai Construction Equipment are emerging in the market. These companies are introducing new technologically advanced products to challenge the market share of market leaders in the Dutch market.
- Ammann, JLG and Bomag have low product diversification; these companies are lagging in adopting new technologies used in construction equipment.
- Caterpillar operates a major manufacturing facility in Den Bosch, located in the southern Netherlands. This facility serves as a key manufacturing and distribution hub for the company's European operations. Additionally, Caterpillar Work Tools, a subsidiary specializing in excavator and wheel loader attachments, operates a 9,000-square-meter distribution center in Den Bosch.
- Komatsu's exclusive distributor in the Netherlands is Van der Spek Vianen B.V., a family-owned company headquartered in Vianen, Utrecht.
- Hitachi Construction Machinery (Europe) N.V. (HCME) is headquartered in Amsterdam. The company was established in 1972 in Oosterhout, The Netherlands, and represents a 50+ year operational history in the European market.
- Liebherr-Nederland B.V., founded in 1981, is headquartered in Amersfoort and serves as the primary operational center for the company's Dutch market activities.
- Wynmalen & Hausmann operates as the authorized Liebherr dealer and distributor for construction equipment in the Netherlands.
- Kubota Holdings Europe B.V. (KHE) is headquartered in Nieuw-Vennep, Netherlands, serving as the regional headquarters for Kubota's entire European operations. Established in 2017, this facility represents the company's commitment to coordinating and growing its European presence.
- In July 2025, Kubota officially opened a new European headquarters. The new headquarters also accommodates offices for Kverneland Group entities Nieuw-Vennep B.V. and Mechatronics B.V.
SNAPSHOT
The Netherlands construction equipment market size by volume is expected to grow at a CAGR of approximately 3.25% from 2025 to 2031.
The following factors are likely to contribute to the growth of the Netherlands construction equipment market during the forecast period:
- Increased Investment in Renovation and Redevelopment of Transport Infrastructure
- Expansion of Offshore Wind Energy Projects is Accelerating Demand for Cranes
- Rebound in Real Estate Investment and Supporting Infrastructure
Base Year: 2025
Forecast Year: 2026-2031
The report examines the current state of the Netherlands construction equipment market and its market dynamics for the period 2025−2030. It covers a detailed overview of several market growth enablers, restraints, and trends. The study covers both the demand and supply sides of the market. It also profiles and analyses leading companies, as well as several other prominent companies operating in the market.
Key Vendors
- Caterpillar
- Volvo CE
- Komatsu
- Hitachi Construction Machinery
- Liebherr
- JCB
- LiuGong
- SANY
- XCMG
- Kobelco
- Zoomlion
- HD Hyundai Construction Equipment
- CNH Industrial
- Kubota Corporation
Other Prominent Vendors
- BOMAG GmbH,
- Bobcat
- Takeuchi Mfg. Co., Ltd.
- Toyota Material Handling
- Develon
- Tadano
- Terex Corporation
- Manitou Group
- Hangcha Group
- Anhui Heli Co., Ltd.
- Shantui Construction Machinery Co. Ltd.
- Wacker Neuson
- JLG
- Ammann
- Yanmar Holdings Co. Ltd.
Distributor Profiles
- Holland Machinery B.V.
- BIG Machinery B.V.
- Reesink Construction Equipment B.V.
- Boss Machinery B.V.
- Troost Machinehandel B.V.
- SMT Netherlands B.V.
Segmentation by Type
Earthmoving Equipment
- Excavator
- Backhoe Loaders
- Wheeled Loaders
- Other Earthmoving Equipment (Other loaders, Bulldozers, Trenchers, Motor Graders)
Road Construction Equipment
- Road Rollers
- Asphalt Pavers
Material Handling Equipment
- Crane
- Forklift & Telescopic Handlers
- Aerial Platforms (Articulated Boom Lifts, Telescopic Boom lifts, Scissor lifts)
Other Construction Equipment
- Dumper
- Concrete Mixer
- Concrete Pump Truck
Segmentation by End Users
- Construction
- Mining
- Manufacturing
- Others (Power Generation, Utilities, Municipal Corporations, Oil & Gas, Cargo Handling, Power Generation Plants, Waste Management)
NETHERLANDS CONSTRUCTION EQUIPMENT MARKET FAQs
What is the growth rate of the Netherlands construction equipment market?
How big is the Netherlands construction equipment market?
What are the trends in the Netherlands construction equipment market?
Who are the key players in the Netherlands construction equipment market?
Which are the major distributor companies in the Netherlands construction equipment market?
Graph 1 CONSTRUCTION EQUIPMENT MARKET, VOLUME (UNITS)
Graph 2 CONSTRUCTION EQUIPMENT MARKET 2025 (%)
Graph 3 EQUIPMENT TYPE (2025)
Graph 4 END-USER (2024)
Graph 5 NETHERLANDS CONSTRUCTION EQUIPMENT MARKET, VOLUME 2022–2031 (UNITS)
Graph 6 NETHERLANDS CONSTRUCTION EQUIPMENT MARKET, VOLUME 2022–2031 ($ MN)
Graph 7 HOME BUILDING PERMITS (2020-Q2 2025); UNITS*1000
Graph 8 COMMERCIAL BUILDING PERMITS (2020-Q2 2025); UNITS*1000
Graph 9 NETHERLANDS EARTHMOVING CONSTRUCTION EQUIPMENT MARKET 2022–2031 (UNITS)
Graph 10NETHERLANDS EARTHMOVING CONSTRUCTION EQUIPMENT MARKET 2022–2031 ($ MN)
Graph 11NETHERLANDS EXCAVATOR 2022–2031 (UNITS SALES)
Graph 12NETHERLANDS EXCAVATOR MARKET 2022–2031 ($ MN)
Graph 13NETHERLANDS BACKHOE LOADERS MARKET 2022–2031 (UNITS)
Graph 14NETHERLANDS BACKHOE LOADERS MARKET 2022–2031 ($ MN)
Graph 15NETHERLANDS WHEELED LOADERS MARKET 2022–2031 (UNITS)
Graph 16NETHERLANDS WHEELED LOADERS MARKET 2022–2031 ($ MN)
Graph 17NETHERLANDS OTHER EARTHMOVING EQUIPMENT MARKET, 2022–2031 (UNITS)
Graph 18 NETHERLANDS OTHER EARTHMOVING EQUIPMENT MARKET 2022–2031 ($ MN)
Graph 19 NETHERLANDS ROAD CONSTRUCTION EQUIPMENT MARKET 2022–2031 (UNIT)
Graph 20 NETHERLANDS ROAD CONSTRUCTION EQUIPMENT MARKET 2022–2031 ($ MN)
Graph 21 NETHERLANDS ROAD ROLLERS MARKET, 2022–2031 (UNIT SALES)
Graph 22 NETHERLANDS ROAD ROLLERS MARKET, 2022–2031 ($ MN)
Graph 23 NETHERLANDS ASPHALT PAVERS MARKET 2022–2031 (UNITS)
Graph 24 NETHERLANDS ASPHALT PAVERS MARKET 2022–2031 ($ MN)
Graph 25 NETHERLANDS MATERIAL-HANDLING EQUIPMENT MARKET 2022–2031 (UNIT SALES)
Graph 26 NETHERLANDS MATERIAL-HANDLING EQUIPMENT MARKET 2022–2031 ($ MN)
Graph 27 NETHERLANDS CRANES MARKET, 2022–2031 (UNIT SALES)
Graph 28 NETHERLANDS CRANES MARKET 2022–2031 ($ MN)
Graph 29 NETHERLANDS FORKLIFTS AND TELESCOPIC HANDLERS MARKET 2022–2031 (UNIT SALES)
Graph 30 NETHERLANDS FORKLIFTS AND TELESCOPIC HANDLERS MARKET 2022–2031 ($ MN)
Graph 31 NETHERLANDS AERIAL PLATFORMS MARKET 2022–2031 (UNIT SALES)
Graph 32 NETHERLANDS AERIAL PLATFORMS MARKET 2022–2031 ($ MN)
Graph 33 NETHERLANDS OTHER CONSTRUCTION EQUIPMENT MARKET 2022–2031 (UNITS)
Graph 34 NETHERLANDS OTHER CONSTRUCTION EQUIPMENT MARKET 2022–2031 ($ MN)
Graph 35 NETHERLANDS DUMPERS MARKET 2022–2031 (UNITS)
Graph 36 NETHERLANDS DUMPERS MARKET 2022–2031 ($ MN)
Graph 37 NETHERLANDS CONCRETE MIXERS MARKET 2022–2031 (UNIT SALES)
Graph 38 NETHERLANDS CONCRETE MIXERS MARKET 2022–2031 ($ MN)
Graph 39 NETHERLANDS CONCRETE PUMP TRUCKS 2022–2031 (UNIT SALES)
Graph 40 NETHERLANDS CONCRETE PUMP TRUCKS 2022–2031 ($ MN)
Graph 41 UTILIZATION OF CONSTRUCTION EQUIPMENT IN CONSTRUCTION INDUSTRY MARKET 2022–2031 (UNIT SALES)
Graph 42 UTILIZATION OF CONSTRUCTION EQUIPMENT IN CONSTRUCTION INDUSTRY MARKET 2022–2031 ($ MN)
Graph 43 UTILIZATION OF CONSTRUCTION EQUIPMENT IN MANUFACTURING INDUSTRY MARKET 2022–2031 (UNIT SALES)
Graph 44 UTILIZATION OF CONSTRUCTION EQUIPMENT IN MANUFACTURING INDUSTRY MARKET 2022–2031 ($ MN)
Graph 45 UTILIZATION OF CONSTRUCTION EQUIPMENT IN MINING INDUSTRY MARKET 2022–2031 (UNIT SALES)
Graph 46 UTILIZATION OF CONSTRUCTION EQUIPMENT IN MINING INDUSTRY MARKET 2022–2031 ($ MN)
Graph 47 UTILIZATION OF CONSTRUCTION EQUIPMENT IN OTHER END-USER INDUSTRIES MARKET 2022–2031 (UNIT SALES)
Graph 48 UTILIZATION OF CONSTRUCTION EQUIPMENT IN OTHER END-USER INDUSTRIES MARKET 2022–2031 ($ MN)
Graph 49 MARKET SHARE OF LEADING VENDORS VS OTHER VENDORS (2025)
Graph 50 CATERPILLAR : SALES BY REGION 2024 (%)
Graph 51 CATERPILLAR : SALES BY BUSINESS SEGMENT 2024 (%)
Graph 52 VOLVO: NET SALES BY REGION 2024 (% SHARE)
Graph 53 VOLVO: NET SALES BY SEGMENT 2024 (% SHARE)
Graph 54 KOMATSU: SALES BY REGION IN 2024 (% SHARE)
Graph 55 KOMATSU: BREAKDOWN OF NET SALES BY BUSINESS SEGMENT 2024 (% SHARE)
Graph 56 HITACHI: SALES BY REGION 2024 (%)
Graph 57 LIEBHERR: SALES BY REGION 2024 (%SHARE)
Graph 58 LIEBHERR: SALES BY SEGMENT 2024 (% SHARE)
Graph 59 JCB: NET SALES 2020- 2023 ($BN)
Graph 60 SANY: NET SALES 2020-2024 ($BN)
Graph 61 XCMG: NET SALES 2020-2024 ($BN)
Graph 62 ZOOMLION: NET SALES 2020- 2024 ($BN)
LIST OF TABLES
Table 1 CONSTRUCTION ACTIVITY: INVESTMENT & GROWTH TRENDS
Table 2 DUTCH MANUFACTURING INITIATIVES IN 2025: STRATEGIC PROGRAMS AND INVESTMENTS
Table 3 KEY CONSTRUCTION PROJECTS DRIVING DEMAND FOR CONSTRUCTION EQUIPMENT IN NETHERLANDS
Table 4 DUTCH OFFSHORE WIND PROJECTS UNDER CONSTRUCTION (Q4 2025)
Table 5 HOUSING PRICES 2020-Q2 2025
Table 6 IMPORT DATA
Table 7 EXPORT DATA
Table 8 TOTAL INCREMENTAL OPPORTUNITY 2026-2031 (EQUIPMENT TYPE)
Table 9 TOTAL INCREMENTAL OPPORTUNITY 2026-2031 (END-USER)
1. SECTION 1 – RESEARCH METHODOLOGY
2. SECTION 2 – RESEARCH OBJECTIVES
3. SECTION 3 – RESEARCH PROCESS
4. SECTION 4 – INTRODUCTION
4.1 Market Coverage
4.2 Report Scope
5. SECTION 5 – MARKET AT A GLANCE
5.1 Market Overview
5.2 Market Snapshot
6. SECTION 6 – EXECUTIVE SUMMARY
7. SECTION 7 – MARKET LANDSCAPE
7.1 PESTEL Analysis
7.2 Economic Scenario
7.3 Tariff Impact
7.4 Key Projects
7.5 Market Dynamics
7.6 Geographic Analysis
7.7 Import & Export Trend Analysis
7.8 Supply Chain Analysis
8. SECTION 8 – SEGMENTATION
8.1 Equipment Type
8.1.1 Equipment Definition (Earthmoving)
8.1.1.1 Earthmoving Equipment (Volume & Value)
8.1.1.2 Excavators
8.1.1.3 Backhoe Loaders
8.1.1.4 Wheeled Loaders
8.1.1.5 Other Earthmoving Equipment (Skid-steer Loaders, Track Loaders, Bulldozers, & Trenchers)
8.1.2 Equipment Definition (Road Construction)
8.1.2.1 Road Construction (Volume & Value)
8.1.2.2 Road Rollers
8.1.2.3 Asphalt Pavers
8.1.3 Equipment Definition (Material Handling)
8.1.3.1 Material Handling (Volume & Value)
8.1.3.2 Cranes
8.1.3.3 Forklifts & Telehandlers
8.1.3.4 Aerial Platforms
8.1.4 Equipment Definition (Other Equipment)
8.1.4.1 Other Equipment (Volume & Value)
8.1.4.2 Dumpers
8.1.4.3 Concrete Mixers
8.1.4.4 Concrete Pump Trucks
8.2 End–users
8.2.1 End–user Definition
8.2.2 Construction
8.2.3 Manufacturing
8.2.4 Mining
8.2.5 Others (Waste Management, Agriculture, Oil & Gas Extraction, Utilities & Energy, Power Generation, Disaster Management and Water Management)
9 SECTION 9 – TECHNOLOGY DEVELOPMENT
10 SECTION 10– COMPETITIVE LANDSCAPE
10.1 Competitive Landscape Overview
10.2 Prominent Vendors
10.3 Other Prominent Vendors
10.4 Distributor Profiles
11 SECTION 11 – REPORT SUMMARY
11.1 Key Insights
11.2 Abbreviations
11.3 Exhibits
11.4 Related Reports
11.5 Database
11.6 Global Reach
11.7 Offerings
Select a license type that suits your business needs
Single User Licence
- Report accessible by one user only
- Free 10% or 3 days of customization
- Free post-sale service assistance
- Continuous support through email
5 User Licence
- Report accessible by 5 users within the organization
- Free 15% or 4.5 days of customization
- Continuous support through email and telephone
- Free analyst hour
- Free Upgrade: If an updated report published within 180 days of purchase, you will get the revised report free of charge
Corporate Licence
- Free Datasheet worth $1500
- Report accessible by the entire organization
- Free 20% or 6 days of customization
- Free post-sale service assistance
- Continuous support through email and telephone
- Direct access to lead analysts
- Free analyst hour
- Free Upgrade: If an updated report published within 180 days of purchase, you will get the revised report free of charge
Datasheet Licence
- Report accessible by 1 user only
- Free 15% or 32 hours of customization
- Free post-sale service assistance
- Direct access to lead analysts
Frequently Asked Questions
What is the growth rate of the Netherlands construction equipment market?
How big is the Netherlands construction equipment market?
What are the trends in the Netherlands construction equipment market?
Who are the key players in the Netherlands construction equipment market?
Which are the major distributor companies in the Netherlands construction equipment market?
Other RELATED Reports

Europe Electric Construction Equipment Market - Strategic Assessment & Forecast 2025-2030
Published : February 2025

Poland Construction Equipment Market – Strategic Assessment & Forecast 2024-2029
Published : January 2025