UAE Construction Equipment Market Research Report 2026-2031
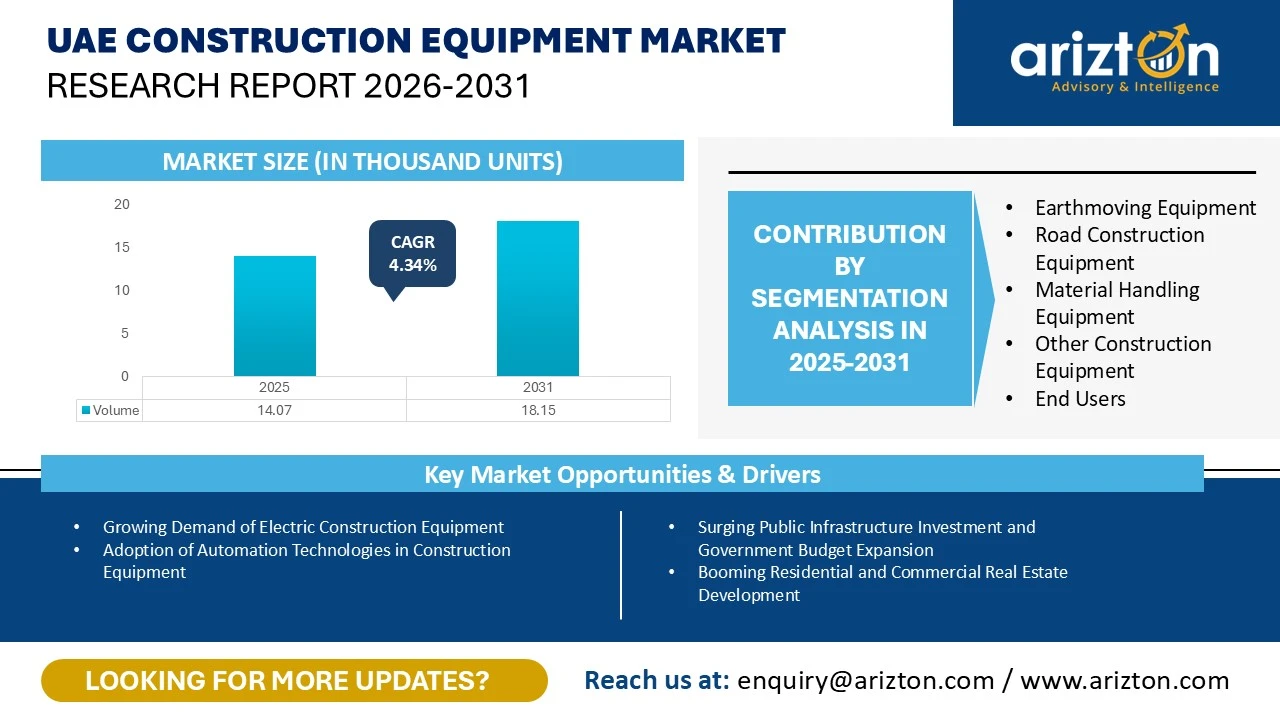
THE UAE CONSTRUCTION EQUIPMENT MARKET SIZE WAS ESTIMATED AT 14.07 THOUSAND UNITS IN 2025 AND IS EXPECTED TO REACH 18.15 THOUSAND UNITS BY 2031, GROWING AT A CAGR OF 4.34% FROM 2025 TO 2031.

UAE Construction Equipment Market Growth Insights – Equipment Demand to Reach 18.15 Thousand Units by 2031, Driven by Government Infrastructure Investments, Economic Diversification, Urban Expansion, and Rising Demand Across Residential, Commercial, Industrial, Transport, and Energy Projects (2026–2031)
To Be Published : July 2026
Last Updated : July 2026
format: PDF
edition : Fifth Edition
166 pages
36 company
5 segments
1 region
1 countries
Purchase Options
UAE Construction Equipment Market Research Report 2026-2031
THE UAE CONSTRUCTION EQUIPMENT MARKET SIZE WAS ESTIMATED AT 14.07 THOUSAND UNITS IN 2025 AND IS EXPECTED TO REACH 18.15 THOUSAND UNITS BY 2031, GROWING AT A CAGR OF 4.34% FROM 2025 TO 2031.
The UAE Construction Equipment Market Research Report Includes Segments By
- Earthmoving Equipment: Excavators, Backhoe Loaders, Wheeled Loaders, and Other Earthmoving Equipment (Other Loaders, Bulldozers, Trenchers, and Motor Graders)
- Road Construction Equipment: Road Rollers and Asphalt Pavers
- Material Handling Equipment: Cranes, Forklifts & Telescopic Handlers, and Aerial Platforms (Articulated Boom Lifts, Telescopic Boom lifts, and Scissor lifts)
- Other Construction Equipment: Dumper, Concrete Mixer, and Concrete Pump Truck
- End Users: Construction, Mining, Manufacturing, and Other End Users
Industry Analysis Report, Regional Outlook, Growth Potential, Price Trends, Competitive Market Share & Forecast 2026–2031.
This report includes market data points, ranging from trend
analyses to market estimates & forecasts that you can customize
UAE CONSTRUCTION EQUIPMENT MARKET REPORT SCOPE
| REPORT ATTRIBUTE | DETAILS |
|---|---|
| MARKET SIZE- VOLUME (2031) | 18.15 Thousand Units |
| MARKET SIZE- VOLUME (2025) | 14.07 Thousand Units |
| CAGR- VOLUME (2025-2031) | 4.34% |
| MARKET SIZE- REVENUE (2031) | USD 1.21 Billion |
| HISTORIC YEAR | 2022-2024 |
| BASE YEAR | 2025 |
| FORECAST YEAR | 2026-2031 |
| EQUIPMENT TYPE | Earthmoving Equipment, Road Construction Equipment, Material Handling Equipment, and Other Equipment |
| END-USERS | Construction, Mining, Manufacturing, and Others |
| KEY VENDORS | Caterpillar, Komatsu, Volvo CE, Deere & Company, Liebherr, Hitachi Construction Machinery, SANY, CNH Industrial, XCMG, HD Hyundai Construction Equipment, Kobelco, and Zoomlion |
UAE CONSTRUCTION EQUIPMENT MARKET SIZE
The UAE construction equipment market size was estimated at 14.07 thousand units in 2025 and is expected to reach 18.15 thousand units by 2031, growing at a CAGR of 4.34% during the forecast period. The UAE construction equipment market is projected to experience steady growth between 2026 and 2031, driven by continued government investment in infrastructure, ongoing economic diversification efforts, and a robust pipeline of residential, commercial, industrial, transport, and energy developments. As large-scale infrastructure and urban expansion projects progress, demand for earthmoving, material handling, and road construction equipment is expected to remain strong.
The market continues to exhibit a highly consolidated competitive structure, with leading global original equipment manufacturers maintaining a significant presence. Major players such as Caterpillar, Komatsu, Liebherr, Volvo Construction Equipment (CE), Hitachi Construction Machinery (HCM), and SANY continue to play a key role in supporting equipment demand and sales across the UAE.
Although geopolitical tensions intensified in 2026 due to the US–Israel–Iran conflict, the UAE's construction sector has remained largely resilient, with project execution and investment activity experiencing only limited disruption.
However, supported by a strong pipeline of government-backed infrastructure projects and sustained public investment, construction activity, and consequently demand for construction equipment, is expected to remain stable throughout the forecast period.
UAE CONSTRUCTION EQUIPMENT MARKET KEY HIGHLIGHTS
- Earthmoving equipment accounted for the largest market share of around 49% in the UAE construction equipment market in 2025. Excavators in the earthmoving segment accounted for the largest share in 2025.
- Demand for earthmoving equipment in the UAE is expected to remain strong in 2026, driven by large-scale infrastructure developments, residential and commercial construction projects, logistics expansion, and industrial investments. Earthmoving equipment continues to represent the largest segment of the construction equipment market due to its critical role in site preparation, excavation, land grading, and material handling.
- A key driver of demand is the UAE's extensive pipeline of infrastructure projects. Major developments such as the Dubai Metro Blue Line, Al Maktoum International Airport expansion, Etihad Rail network expansion, Palm Jebel Ali, Dubai Urban Master Plan 2040 projects, and numerous industrial and logistics developments require significant earthworks and site development activities.
- Demand for material handling and lifting equipment, including cranes, aerial work platforms (AWPs), forklifts, and telescopic handlers, is expected to increase in the UAE during 2026, driven by strong growth in construction, logistics, industrial, and infrastructure sectors. The country's ongoing investments in transportation networks, industrial zones, commercial developments, and energy projects are creating substantial requirements for equipment used in lifting, material movement, installation, and maintenance activities.
- Large-scale developments such as the expansion of Al Maktoum International Airport, industrial projects within Khalifa Economic Zones Abu Dhabi (KEZAD), and logistics hub developments across Dubai and Abu Dhabi are expected to support demand for cranes, telehandlers, and forklifts.
- The road construction equipment segment is projected to grow at a CAGR of 4.28% from 2025 to 2031.
- Demand for road rollers in the UAE is projected to grow in 2026, supported by a strong pipeline of road infrastructure and transportation development projects. In November 2025, Dubai's Roads and Transport Authority (RTA) announced plans to deliver 72 road projects, encompassing 226 km of roads and 115 bridges and tunnels by 2027, which is expected to drive demand for compaction equipment.
- In June 2026, Abu Dhabi's Department of Municipalities and Transport (DMT) began construction of a Dh291.11 million ($79.2 million) dual carriageway linking the Al Sarouj district with the Al Ain Industrial Area, as part of efforts to improve traffic flow and support urban growth in the city. The development will also incorporate a 5.2-kilometre cycling track, six kilometres of pedestrian walkways, and six roadside bus stops to support sustainable and multi-modal transport.
- In 2025, the construction segment accounted for around 72% of the construction equipment usage market in the UAE construction industry. The segment is projected to expand at a CAGR of 4.39%.
- The UAE construction sector is increasingly shifting its focus from traditional real estate developments toward large-scale infrastructure projects in 2026. While the property market remains active, contractors are seeing stronger growth opportunities in government-backed infrastructure investments, particularly following the geopolitical uncertainty created by the Iran conflict. Importantly, major projects have continued without cancellations, indicating resilience across the construction industry.
- Key infrastructure projects driving this transition include Abu Dhabi's Dh55 billion ($15 billion) public-private partnership (PPP) pipeline, the Dh34 billion ($9.2 billion) Dubai Metro Gold Line, major drainage and flood-mitigation upgrades worth approximately Dh2.5 billion ($680 million), expanding investments in transportation, utilities, water infrastructure, logistics facilities, energy networks, data centres, and urban development projects.
- The expansion of the UAE's manufacturing sector is expected to drive strong demand for construction equipment in 2026.
- The trend is particularly evident in Sharjah, where industrial investments surpassed Dh3.51 billion ($960 million) across 99 projects over the past five years in 2026, including Dh1.6 billion ($440 million) from 31 projects in 2025. With more than 2,800 factories across 21 industrial zones and accounting for approximately 40% of the UAE's industrial establishments, Sharjah's expanding industrial base is generating sustained demand for construction equipment required for factory construction, warehouse development, utility installations, and supporting infrastructure projects.
UAE CONSTRUCTION EQUIPMENT MARKET DRIVERS
Surging Public Infrastructure Investment and Government Budget Expansion
- The UAE's sustained public infrastructure investment is a major driver of construction equipment demand. Federal and emirate-level governments are investing heavily in transport networks, public buildings, renewable energy, utilities, and mixed-use developments, increasing demand for earthmoving, material handling, road construction, and concrete equipment.
- The government has allocated AED 11 billion ($3 billion) for dams, flood control, stormwater systems, and water infrastructure, alongside AED 9 billion ($2.45 billion) for social infrastructure including schools, healthcare facilities, universities, and sports complexes. The National Investment Strategy 2031 aims to double annual FDI inflows to $65.35 billion by 2031, supporting long-term construction activity.
- The 2026 Federal Budget increased to AED 92.4 billion ($25.2 billion), with 48% allocated to infrastructure. Dubai approved AED 99.5 billion ($27.1 billion) in 2026 spending, including higher infrastructure investment, while major projects such as the Dubai Metro Blue Line and Abu Dhabi's AED 55 billion PPP pipeline will further strengthen equipment demand through the forecast period.
Booming Residential and Commercial Real Estate Development
- The UAE's rapidly expanding real estate sector is a key driver of construction equipment demand, particularly across residential, mixed-use, and commercial developments. Dubai and Abu Dhabi continue to witness strong construction activity, with 10,800 residential units completed in Dubai in 2025 and another 6,000 planned for 2026. Despite this, housing demand continues to exceed supply, prompting developers to accelerate new projects and increasing demand for excavators, cranes, wheel loaders, dump trucks, and concrete equipment.
- Dubai's $1.5 billion housing programme for 3,004 homes and Abu Dhabi's approval of nearly 190,000 residential units, including 30,000 for UAE Nationals, are further supporting equipment demand.
- In Q1 2026, Dubai issued 10,776 building permits, up 12% year-on-year, while permitted built-up area rose 48% to 3.9 million square metres, reflecting robust construction activity. Large-scale developments such as Burj Binghatti Jacob & Co Residences and Sobha City's Dh40 billion ($10.9 billion) mixed-use project will continue driving long-term demand for construction equipment through 2031.
Tourism Expansion and Hospitality Infrastructure Growth
- The UAE's expanding tourism and hospitality sector is a key driver of construction equipment demand, supported by large-scale investments in hotels, resorts, airports, cultural attractions, and mixed-use developments.
- Tourism remained strong in early 2026, with hotel revenues exceeding AED 9.8 billion ($2.67 billion) during January and February. Under the UAE Tourism Strategy 2031, the country aims to attract 40 million annual hotel guests, while Abu Dhabi targets 39.3 million visitors, 52,000 hotel rooms, and AED 90 billion ($24.5 billion) in tourism GDP by 2030.
- Major developments, including the $2.4 billion Wynn Al Marjan Island resort, Guggenheim Abu Dhabi, Zayed National Museum, and Azizi Developments' AED 75 billion ($20.4 billion) investment in 151 hotels, are driving demand for excavators, cranes, concrete equipment, and material handling machinery. Government initiatives such as Dubai's Hotel Incentive Programme are further accelerating hospitality construction, ensuring sustained equipment demand throughout the forecast period.
"Download your free sample report to dive into the full breakdown of the UAE construction equipment market, with key segment insights and market size by volume and value."
UAE CONSTRUCTION EQUIPMENT MARKET TRENDS
Growing Demand for Electric Construction Equipment
- The adoption of electric and low-emission construction equipment is emerging as a key trend in the UAE construction equipment market, driven by the UAE Net Zero 2050 Strategic Initiative and broader decarbonization policies. While diesel-powered machinery continues to dominate large-scale construction, contractors are increasingly adopting electric alternatives to reduce emissions, lower operating costs, and meet sustainability requirements in infrastructure and commercial projects.
- Volvo Construction Equipment demonstrated this shift by deploying the L120H Electric wheel loader in Abu Dhabi, where operational trials showed productivity comparable to diesel models.
- JCB has expanded the availability of its 19C-1E electric mini excavator for use in emission-sensitive environments such as hospitals, airports, and schools. The market is also witnessing the introduction of hydrogen-electric equipment, including Niftylift's HR15 H2E and HR17 H2E boom lifts. As manufacturers such as Volvo CE, JCB, and Develon continue expanding their electric equipment portfolios, adoption of low-emission construction machinery across the UAE is expected to accelerate.
Adoption of Automation Technologies in Construction Equipment
- The UAE construction sector is rapidly adopting automation and digital technologies to improve productivity, efficiency, and operator safety. Driven by tighter project schedules, rising labour costs, and shortages of skilled operators, contractors are increasingly investing in intelligent construction equipment equipped with telematics, machine control systems, and digital fleet management platforms.
- These technologies enable real-time monitoring of fuel consumption, equipment utilization, maintenance, idle time, and operator performance. Leading manufacturers, including Caterpillar, Komatsu, Volvo Construction Equipment, and Hitachi Construction Machinery, are expanding connected equipment solutions across the UAE.
- In 2025, Al Marwan introduced the Caterpillar Cat 775 off-highway truck featuring advanced safety systems, improved fuel efficiency, and autonomous-ready capabilities. Volvo CE has also standardized its Haul Assist system on articulated haulers sold in the UAE, enabling real-time payload monitoring and productivity insights. As investments in smart cities, transport infrastructure, and industrial projects continue, AI-enabled fleet management, predictive maintenance, and semi-autonomous equipment are expected to accelerate digital transformation across the UAE construction equipment market.
Growing Adoption of Alternative Fuels in Construction Equipment
- The adoption of alternative fuels is becoming an important trend in the UAE construction equipment market as contractors and manufacturers seek to reduce carbon emissions while maintaining equipment performance. Although diesel machinery remains dominant in heavy-duty applications, the industry is gradually adopting cleaner fuels such as hydrogen, hydrotreated vegetable oil (HVO), biodiesel, compressed natural gas (CNG), and renewable diesel.
- This transition is supported by the UAE Net Zero by 2050 Strategic Initiative, UAE Energy Strategy 2050, and National Hydrogen Strategy 2050, which aim to produce 15 million tonnes of low-carbon hydrogen annually by 2050. HVO and biodiesel can be used in many existing diesel engines with minimal modifications, enabling cost-effective emissions reduction.
- Meanwhile, hydrogen-powered engines and fuel-cell technologies offer longer operating hours and faster refuelling than battery-electric equipment. Manufacturers such as JCB and Cummins are advancing alternative-fuel technologies, supporting greater adoption across infrastructure, transport, renewable energy, and industrial projects where sustainability requirements are increasingly shaping equipment selection.
INDUSTRY RESTRAINTS
Increase in Building Raw Material Prices and Construction Costs
- Rising construction input costs remain a major restraint on the UAE construction equipment market. Higher prices for cement, steel, aluminum, copper, concrete, and other materials are increasing project costs, compressing contractor margins, and encouraging greater reliance on equipment rental instead of new purchases.
- Global trade disruptions, geopolitical tensions, elevated freight costs, and shipping disruptions through the Strait of Hormuz have further increased material prices in 2026. By May 2026, reinforced concrete prices had risen by 50%, hollow bricks by 71%, cement by 8.3%, and crane and lifting service charges by 14.3%. Although developers have largely kept projects on schedule through early procurement, fixed-price contracts, diversified sourcing, and locally produced materials, profitability remains under pressure.
- Additionally, rising diesel prices are increasing equipment operating and transportation costs, reducing capital available for fleet expansion. Together, these factors are delaying equipment procurement, extending project timelines, and moderating demand for new construction equipment in the UAE during the forecast period.
Skilled Labour Shortages and Rising Emiratization Compliance Costs
- A major challenge for the UAE construction equipment market in 2026 is the shortage of skilled equipment operators, technicians, and site supervisors, combined with rising labour compliance costs under the Emiratization Programme.
- As construction activity accelerates across infrastructure, industrial, and real estate projects, contractors are struggling to recruit qualified personnel to operate and maintain increasingly advanced machinery. Private-sector companies with 50 or more employees must achieve 8% Emiratization in skilled roles by June 2026 and 10% by December 2026, with non-compliance attracting monthly penalties of AED 10,000 ($2,723) per unfilled position from July 2026.
- These requirements increase recruitment, training, compensation, and compliance costs while contractors continue to rely heavily on expatriate workers. Labour shortages also reduce equipment productivity, increase idle time and overtime costs, and delay project execution. As a result, contractors are allocating more resources to workforce development and regulatory compliance, limiting capital available for fleet expansion and new equipment purchases.
Volatile Fuel Prices Increase Equipment Ownership and Operating Costs
- Rising and volatile diesel prices are a key challenge for the UAE construction equipment market, as most equipment fleets remain dependent on diesel-powered machinery. In 2026, diesel prices surged from AED 2.72 ($0.74) per litre in March to AED 4.69 ($1.28) in May—a 72% increase—before easing slightly to AED 4.33 ($1.18) in June. This sharp rise significantly increased equipment operating, transportation, and site logistics costs, reducing contractor profitability, particularly for fixed-price projects where higher fuel costs cannot be passed on to clients.
- The UAE's withdrawal from OPEC and OPEC+ in May 2026 further increased uncertainty around future fuel prices. Equipment distributors have also reported higher operating and maintenance costs across the construction sector. Although rising fuel prices are encouraging interest in electric and alternative-fuel equipment, adoption remains limited by high upfront costs and inadequate charging infrastructure.
- Consequently, fuel price volatility is expected to slow fleet expansion and delay new equipment purchases as contractors adopt more cautious capital spending strategies.
UAE CONSTRUCTION EQUIPMENT MARKET VENDOR LANDSCAPE
- Caterpillar, Komatsu, Liebherr, XCMG, Volvo CE, SANY, and Hitachi Construction Machinery are the front-runners in the country’s construction equipment market. These companies have a strong market share and offer a diverse set of equipment in the UAE market.
- Terex, Wacker Neuson, Tadano, Manitou, Ammann, Kato Works, Bomag, and Toyota Material Handling are niche market players in the market. These companies offer low product diversification and have a strong presence in the Indonesian market.
- Bobcat, Zoomlion, Kobelco, JCB, LiuGong, XCMG, DEVELON, CNH Industrial, and HD Hyundai Construction Equipment are emerging in the market. These companies are introducing new technologically advanced products to challenge the market share of market leaders in the UAE market.
- Manitowoc, AUSA and JLG have low product diversification; these companies are lagging in adopting new technologies used in construction equipment.
- In 2026, Al-Bahar launched the Back2Work Commitment, a service guarantee integrated into Customer Value Agreements (CVAs). The initiative aims to improve equipment reliability and uptime for contractors, quarry operators, and infrastructure developers operating Cat fleets in the UAE.
- In 2026, Caterpillar's authorized UAE dealer, Al-Bahar, introduced an exclusive Cat C15 Generator Rebuild Program across its Gulf markets, including the UAE. The program is designed to extend equipment life, reduce downtime, and lower ownership costs for power generation customers.
- In 2025, Volvo CE and its UAE distributor FAMCO received major recognition at the Construction Machinery Middle East (CMME) Awards 2025. Volvo CE's new-generation A40 articulated hauler won Earth Moving Machinery of the Year, while the EC210 excavator won Excavator of the Year. FAMCO was also named Distributor of the Year – GCC.
- In 2026, SANY strengthened its partnership with Mohammad Abdullah Al Areedh Ltd. Co., one of Saudi Arabia's leading heavy-lifting and equipment rental companies, through the delivery of 20 new 50-ton truck cranes at Al Areedh's operational base in Jubail.
- In July 2025, Emirates Global Motor Electric, part of the Al Fahim Group and SANY's electric truck distributor in the UAE, introduced three new SANY electric commercial vehicles at Mobility Live Middle East 2025. These included an Electric 8x4 Dump Truck, 4x2 Electric Chassis Truck and 6x4 Electric Tractor Head.
SNAPSHOT
The UAE construction equipment market size by volume is expected to grow at a CAGR of approximately 4.34% from 2025 to 2031.
The following factors are likely to contribute to the growth of the UAE construction equipment market during the forecast period:
- Surging Public Infrastructure Investment and Government Budget Expansion
- Booming Residential and Commercial Real Estate Development
- Tourism Expansion and Hospitality Infrastructure Growth
Base Year: 2025
Forecast Year: 2026-2031
The report considers the present scenario of the UAE construction equipment market and its market dynamics for 2025−2030. It covers a detailed overview of several market growth enablers, restraints, and trends. The study covers both the demand and supply sides of the market. It also profiles and analyzes leading companies and several other prominent companies operating in the market.
Key Vendors
- Caterpillar
- Komatsu
- Volvo CE
- Deere & Company
- Liebherr
- Hitachi Construction Machinery
- SANY
- CNH Industrial
- XCMG
- HD Hyundai Construction Equipment
- Kobelco
- Zoomlion
Other Prominent Vendors
- Bobcat
- DEVELON
- JCB
- Toyota Material Handling
- The Manitowoc Company, Inc.
- JLG Industries
- Terex Corporation
- Manitou Group
- Wacker Neuson SE
- LiuGong
- Ammann Group Holding AG
- Tadano Ltd.
- BOMAG
- AUSA
- KATO WORKS CO., LTD.
Distributor Profiles
- Al-Bahar (Mohamed Abdulrahman Al-Bahar Group)
- FAMCO (Al-Futtaim Auto & Machinery Company)
- Galadari Trucks & Heavy Equipment (GTHE)
- Middle East Crane Equipment Trading LLC (MECET)
- United Motors & Heavy Equipment Co. LLC (UMHE)
- Falcon Motors LLC
- Al Shirawi Machinery LLC
- Al Marwan Machinery
- Kanoo Machinery
- Al Assala Trading LLC
Segmentation by Type
Earthmoving Equipment
- Excavator
- Backhoe Loaders
- Wheeled Loaders
- Other Earthmoving Equipment (Other loaders, Bulldozers, Trenchers, Motor Graders)
Road Construction Equipment
- Road Rollers
- Asphalt Pavers
Material Handling Equipment
- Crane
- Forklift & Telescopic Handlers
- Aerial Platforms (Articulated Boom Lifts, Telescopic Boom lifts, Scissor lifts)
Other Construction Equipment
- Dumper
- Concrete Mixer
- Concrete Pump Truck
Segmentation by End Users
- Construction
- Mining
- Manufacturing
- Others (Power Generation, Utilities, Municipal Corporations, Oil & Gas, Cargo Handling, Power Generation Plants, Waste Management)
UAE CONSTRUCTION EQUIPMENT MARKET FAQs
What is the growth rate of the UAE construction equipment market?
How big is the UAE construction equipment market?
What are the trends in the UAE construction equipment market?
Who are the key players in the UAE construction equipment market?
Which are the major distributor companies in the UAE construction equipment market?
For more details, please reach us at [email protected]
For more details, please reach us at [email protected]
Select a license type that suits your business needs
Single User Licence
- Report accessible by one user only
- Free 10% or 3 days of customization
- Free post-sale service assistance
- Continuous support through email
5 User Licence
- Report accessible by 5 users within the organization
- Free 15% or 4.5 days of customization
- Continuous support through email and telephone
- Free analyst hour
- Free Upgrade: If an updated report published within 180 days of purchase, you will get the revised report free of charge
Corporate Licence
- Free Datasheet worth $1500
- Report accessible by the entire organization
- Free 20% or 6 days of customization
- Free post-sale service assistance
- Continuous support through email and telephone
- Direct access to lead analysts
- Free analyst hour
- Free Upgrade: If an updated report published within 180 days of purchase, you will get the revised report free of charge
Datasheet Licence
- Report accessible by 1 user only
- Free 15% or 32 hours of customization
- Free post-sale service assistance
- Direct access to lead analysts
Frequently Asked Questions
What is the growth rate of the UAE construction equipment market?
How big is the UAE construction equipment market?
What are the trends in the UAE construction equipment market?
Who are the key players in the UAE construction equipment market?
Which are the major distributor companies in the UAE construction equipment market?
Other RELATED Reports
Qatar Construction Equipment Market- Strategic Assessment & Forecast 2025-2030
Published : July 2025