U.S. Agriculture Equipment Market Research Report 2026-2031
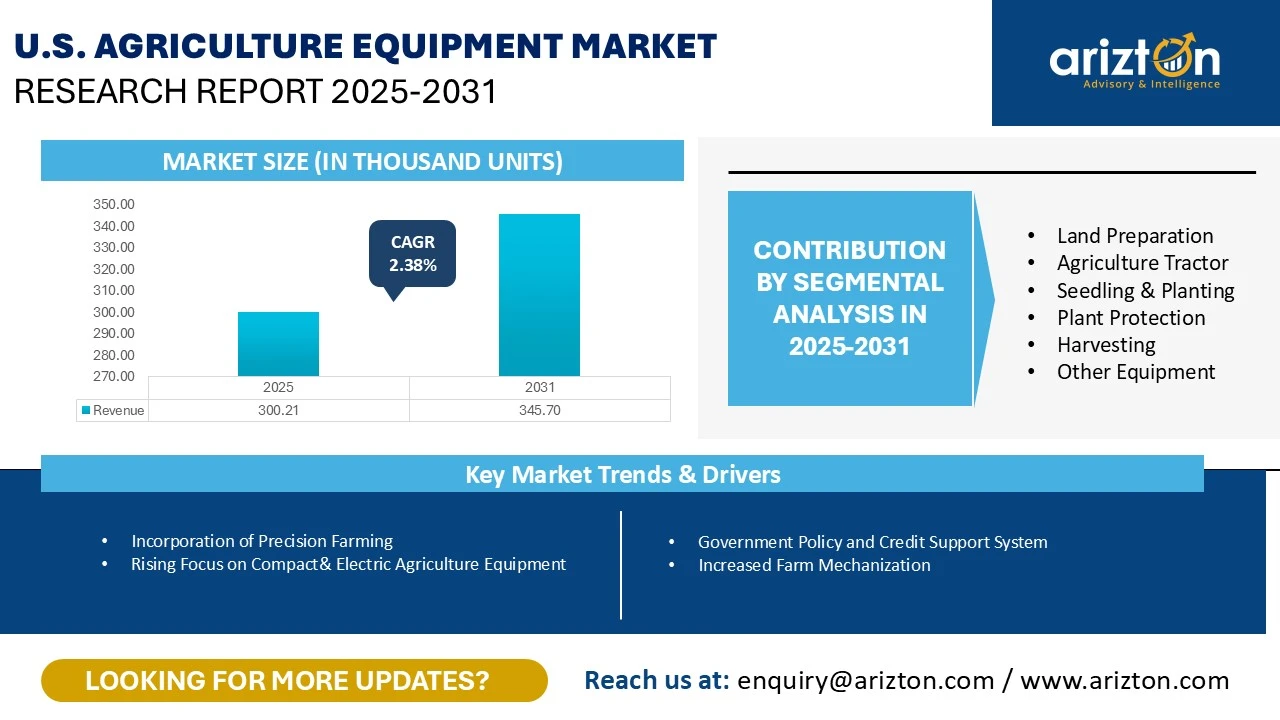
THE U.S. AGRICULTURE EQUIPMENT MARKET SIZE WAS ESTIMATED AT 300.21 THOUSAND UNITS IN 2025 AND IS EXPECTED TO REACH 345.7 THOUSAND UNITS BY 2031, GROWING AT A CAGR OF 2.38%.

The U.S. Agriculture Equipment Market Size, Share, Trends By Equipment Type, By Land Preparation, By Agriculture Tractor, By Seedling & Planting, By Plant Protection, By Harvesting, By Other Equipment, & By Region.
Published Date : January 2026
Last Updated : January 2026
format: PDF
edition : Third Edition
108 pages
5 region
1 countries
17 company
06 segments
Purchase Options
U.S. Agriculture Equipment Market Research Report 2026-2031
THE U.S. AGRICULTURE EQUIPMENT MARKET SIZE WAS ESTIMATED AT 300.21 THOUSAND UNITS IN 2025 AND IS EXPECTED TO REACH 345.7 THOUSAND UNITS BY 2031, GROWING AT A CAGR OF 2.38%.
The U.S. Agriculture Equipment Market Research Report Includes Segments By
- Equipment Type: Land Preparation, Agriculture Tractor, Seedling & Planting, Plant Protection, Harvesting, And Other Equipment
- Land Preparation: Tillers, Plough, and Harrow
- Seedling & Planting: Transplanters, Planters, and Seed Drillers
- Harvesting: Tractor-Mounted and Self-Propelled
- Other Equipment: Mowers, Windrowers, and Balers
- Region: Northeast, Midwest, Southwest, Southeast, & West
Industry Analysis Report, Regional Outlook, Growth Potential, Price Trends, Competitive Market Share & Forecast 2025–2031.
This report includes market data points, ranging from trend
analyses to market estimates & forecasts that you can customize
U.S. AGRICULTURE EQUIPMENT MARKET REPORT SCOPE
| REPORT ATTRIBUTE | DETAILS |
|---|---|
| MARKET SIZE (2031) | 345.7 Thousand Units |
| Market Size (2025) | 300.21 Thousand Units |
| CAGR (2025-2031) | 2.38% |
| HISTORIC YEAR | 2022-2024 |
| BASE YEAR | 2025 |
| FORECAST YEAR | 2026-2031 |
| SEGMENTS BY | Land Preparation, Agriculture Tractor, Seedling & Planting, Plant Protection, Harvesting, And Other Equipment |
| REGIONAL ANALYSIS | Northeast, Midwest, Southwest, Southeast, & West |
| KEY PLAYERS | AGCO, CNH Industrial, John Deere, Kubota, and Mahindra |
U.S. AGRICULTURAL EQUIPMENT MARKET SIZE
The U.S. agriculture equipment market size was estimated at 300.21 thousand units in 2025 and is expected to reach 345.7 thousand units by 2031, growing at a CAGR of 2.38% during the forecast period. The market is growing rapidly, driven by advances in mechanization, the use of precision farming technologies, and supportive government policies. New technologies like real-time data, GPS, and smart sensors are helping farmers improve efficiency and productivity. Labor shortages and increased government efforts to boost agricultural output are also encouraging farmers to invest in modern agriculture equipment.
Government initiatives play a crucial role in supporting farmers. In 2024, the USDA provided $3.1 billion in relief through the Inflation Reduction Act, enabling over 30,000 farmers and ranchers facing financial distress to remain on their land. Furthermore, many states offer targeted programs for new and small farmers. For instance, Maryland's Southern Maryland Farm Mini Grant Program provides up to $2,000 in matching grants for start-up projects and farm diversification.
The U.S. stands as a global leader in agricultural machinery, with its sector benefiting from supportive government policies and a proactive approach to adapting to climate change and evolving global food demands. Factors such as government policies, manufacturing reshoring, infrastructure investments, and rising commodity prices have collectively boosted market demand, solidifying the U.S. as a lucrative market for agricultural machinery.
IMPACT OF TARIFF
- A trade war is an economic conflict where countries place tariffs or other trade barriers on each other, usually in response to similar actions. A global trade war began when the U.S. started adding tariffs on more countries.
- On April 2, 2025, U.S. President Donald Trump announced new tariffs, called reciprocal tariffs, on imports from around 90 countries.
- The local manufacturing of agriculture equipment is also impacted by implementation of tariffs on raw materials imported into the U.S. market from other countries. High tariffs imported raw material such as iron, steel, rubber, aluminum and glass. The U.S. government presently have 50% tariffs rates on steel and aluminum imports from other countries.
U.S. AGRICULTURAL EQUIPMENT MARKET TRENDS & DRIVERS
Incorporation of Precision Farming
Precision farming is quickly transforming the U.S. agriculture equipment market as farmers shift from broad management practices to highly targeted, data-driven operations. This growth is fueled by the increasing adoption of technologies such as GPS guidance, variable-rate technology (VRT), sensors, drones, telematics, and cloud analytics, all of which help reduce input costs and increase crop yields.
Key drivers of this trend include labor shortages, rising input prices (such as seeds, fertilizers, and fuel), sustainability goals, and stronger evidence of return on investment (ROI) from precision farming practices. Major OEMs are responding by developing integrated platforms that connect tractors and implements to farm-level decision-making tools.
Rising Focus on Compact& Electric Agriculture Equipment
In 2025, the U.S. agriculture equipment market is experiencing a notable rise in the use of electric and compact electric machinery. This shift reflects a broader movement towards sustainability, cost-efficiency, and versatility.
Factors driving this trend include stricter emissions regulations, decreasing battery costs, and a growing demand for quieter, low-maintenance machines, particularly on smaller farms, specialty operations, and niche applications such as vineyards and urban agriculture.
One significant aspect of this trend is the increasing popularity of compact electric tractors, typically those with under 40 horsepower. Their size and electric power make them ideal for small-acreage farmers and orchard operators. These machines provide instant torque, minimal noise, and zero tailpipe emissions, appealing for both environmental and economic reasons.
Government Policy and Credit Support System
In the U.S., strong government policies and credit support are essential for increasing demand for agricultural machinery. The Farm Service Agency (FSA) provides critical financing to farmers for operating expenses, such as purchasing equipment, through its direct and guaranteed loan programs. Additionally, these loans support long-term investments in land and machinery.
In 2024, the USDA implemented significant policy changes to its farm loan programs. This update introduces a low-interest installment option for distressed borrowers and streamlines the paperwork, which shortens the loan application process. These reforms make it easier for farmers to access credit, allowing them to invest strategically in new tractors, precision agricultural implements, and other capital-intensive machinery.
Together, these layers of policy and credit support reduce the financial risks associated with investing in expensive farm equipment. They encourage modernization and accelerate mechanization, especially for precision and climate-smart technologies. As a result, farmers are more willing and able to upgrade to efficient, high-productivity machinery, boosting demand in the agricultural equipment market.
Increased Farm Mechanization
In 2025, the growing trend of farm mechanization is significantly driving demand for agricultural equipment in the U.S. As labor becomes increasingly scarce and costly, many farmers are turning to machinery to bridge the gap. This shift enhances efficiency and reduces reliance on manual labor.
Mechanized solutions are not limited to large farms; medium and smaller-scale operations are also adopting more tractors, harvesters, and smart implements.
A key factor fuelling this transition is the incorporation of advanced technologies into mechanized equipment. Modern tractors and combines now frequently feature GPS, telematics, remote sensing, and auto-steering systems. These advancements not only enhance productivity but also empower farmers to make data-driven decisions, optimize the use of fuel, seeds, and fertilizers, and minimize waste.
INDUSTRY RESTRAINTS
Fluctuations in Agricultural Commodity Prices
Low farmer profitability is one of the most influential restraints on the U.S. agriculture equipment market in 2025. Farm income across several crops and livestock segments has been under pressure due to falling commodity prices, rising input costs, and unpredictable weather conditions.
As margins shrink, farmers prioritize essential operational expenses over capital-intensive investments like tractors, harvesters, planters, sprayers, and precision farming tools. This financial pressure is particularly strong among small and mid-sized farms, which make up a large share of U.S. agricultural operations.
Input costs, including fertilizers, pesticides, fuel, and labor, have continued to climb, reducing disposable income that could otherwise be allocated toward equipment upgrades. Many farmers are opting to repair older machines instead of purchasing new ones, extending equipment life cycles and slowing market demand.
U.S. AGRICULTURE EQUIPMENT MARKET SEGMENTATION INSIGHTS
- The agricultural machinery market is dominated by tractors, which are projected to hold the largest market share of in 2025. This segment is expected to grow at a CAGR of 2.37% during the forecast period. Other agricultural equipment, such as mowers, windrowers, and balers, will collectively account for a significant market share in 2025.
- Within the land preparation equipment segment, tillers and plows are key players, holding substantial market shares in 2025. This entire segment is anticipated to expand at a CAGR of 2.43% by 2031.
- In the seedling and planting sector, planters are expected to lead, capturing a market share of over 03% in 2025. This segment is projected to show significant growth during the forecast period.
- Self-propelled harvesters hold a significant position within the U.S. agricultural equipment market. Their popularity stems from several advantages, including faster harvesting speeds, suitability for high-capacity farms, reduced labor dependency, and minimized crop loss due to precise cutting mechanisms. In the broader harvesting equipment segment, self-propelled harvesters are forecast to account for the largest market share in 2025.
- The demand for planting and transplanting equipment is strengthening as farmers increasingly prioritize uniformity and input efficiency. Innovations such as row-by-row seed singulation, electric meters, and retrofit precision kits enable operators to achieve yield improvements without requiring complete system overhauls, offering an attractive solution when capital investment is limited.
- Similarly, plant protection systems are evolving towards more targeted approaches. This includes the adoption of low-volume, camera-guided sprayers (often referred to as "see-and-spray" technology) and biologically friendly delivery systems. These advancements aim to reduce chemical usage and drift, thereby ensuring compliance with increasingly stringent environmental regulations.
U.S. AGRICULTURE EQUIPMENT MARKET REGIONAL ANALYSIS
- In regions such as West, Southwest, Midwest, including Northeast and Southeast in U.S., which are heavily reliant on agriculture (e.g., Corn, soybeans, wheat, cotton, fruits, dairy etc.) large landholdings drive the demand for agriculture equipment. These regions use tractors to improve productivity and reduce labor costs, making mechanization a key to enhancing farm efficiency.
- The Western U.S. is an important farming region, especially known for growing fruits and specialty crops like almonds, grapes, and wine. These crops rely heavily on irrigation because of the area's low rainfall. While wheat and rice are also grown, their production is smaller compared to other regions due to limited water resources.
- The Southwest region accounted for the largest share of over 49% of the U.S. agriculture equipment market in 2025. The region supports the growth of several important crops. Cotton is one of the leading crops, especially in Texas, Arizona, and New Mexico. The region is also famous for its Chile peppers, particularly the Hatch green chiles from New Mexico.
- The Midwest U.S. is an important farming area, known for growing main crops like corn and soybeans. These crops grow well because of the region’s good soil and enough rainfall. Wheat is also grown, especially in Kansas.
- In Northeast U.S. is a key agricultural hub, famous for its prominent dairy industry, especially in states such as New York and Vermont, which are recognized for their premium milk and cheese production.
- In Southeast U.S. states include Alabama, Florida, Georgia, Kentucky, Mississippi, North Carolina, South Carolina and Tennessee. The Southeast U.S. is a significant agricultural region, known for producing a variety of crops due to its warm climate and fertile soil. Main crops grown in the Southeast include cotton, peanuts, tobacco, and soybeans.
U.S. AGRICULTURAL EQUIPMENT MARKET VENDOR ANALYSIS
The agriculture equipment market in the U.S. is competitive and dominated by both global and strong domestic manufacturers. Companies like John Deere, CNH Industrial, AGCO & Kubota hold a significant share of the market. The industry features a mix of well-established global brands and regional players. As international companies continue to strengthen their presence, smaller regional manufacturers may face challenges competing with these larger, well-resourced companies.
In early 2024, AGCO strengthened its U.S. presence by launching Fendt electric tractors and expanding its Fuse Smart Farming platform, which uses precision technology to boost farm efficiency.
In February 2025, John Deere partnered with Drive TLV, giving it access to a wide network of startups. This helps the company improve in areas like autonomy, sensors, electrification, and connectivity, allowing them to offer more efficient and high-tech solutions to farmers.
Deere & Company & CNH Industrials dominated the US agriculture equipment market. These players thrive on innovation in the agriculture equipment market. They are increasingly investing in developing advanced Agri machinery technology for precision farming and machine automation.
Recent Developments in the U.S. Agriculture Equipment Market
- In 2024, AGCO purchased an 85% stake in Trimble Inc for $2 billion, creating a joint venture focused on autonomous technologies and other advanced technologies for farm equipment.
- The US government announced a National Strategy for reducing food loss and waste and recycling organics in 2024. The government strategy aims to reduce the food loss and waste by 50% by 2030.
- CNH Industrial has launched satellite internet merger across North American markets, starting with pilot regions in the US in 2024. This partnership allows farmers in rural locations to use connected, smart farming equipment in real time, boosting efficiency and advancing precision agriculture.
WHY SHOULD YOU BUY THIS REPORT?
This report is among the few in the market that offer outlook and opportunity analyses forecast in terms of the following:
- Market Size & Forecast Volume (Units) 2022–2031
- Segmentation by Equipment Type
- Production and trade values
- Major current and upcoming projects and investments
- Competitive intelligence about the economic scenario, advantages, industry dynamics, and industry shares
- Innovative technologies
- Share by each equipment segment
- Company profiles of major and other prominent vendors
- Company profiles of distributors
- Market shares of major vendors
SNAPSHOT
The U.S. agriculture equipment market size is expected to grow at a CAGR of approximately 2.38% from 2025 to 2031.
The following factors are likely to contribute to the growth of the U.S. agriculture equipment market during the forecast period:
- Government Policy And Credit Support System
- Increased Agricultural Productivity & Exports
- Increase in Farm Mechanization
Base Year: 2025
Forecast Year: 2026-2031
The report considers the present scenario of the U.S. agriculture equipment market and its market dynamics for 2026−2031. It covers a detailed overview of several market growth enablers, restraints, and trends. The study covers both the demand and supply sides of the market. It also profiles and analyzes leading companies and several other prominent companies operating in the market.
Key Company Profile
- AGCO
- Business Overview
- Product Offerings
- Key Developments
- Key Strategies
- Key Strengths
- Key Opportunities
- CNH Industrial
- John Deere
- Kubota
- Mahindra
Other Prominent Company Profiles
- Yanmar
- Same Deutz-Fahr
- Class
- Kioti
- ISEKI
- Lovol Tractors
- YTO Group
- Zoomlion
- Krone
- KUHN Group
- TYM Corporation
- Great Plains Ag
Segmentation by Equipment Type
- Land Preparation
- Tillers
- Plough
- Harrow
- Agriculture Tractor
- Seedling & Planting
- Transplanters
- Planters
- Seed Drillers
- Plant Protection
- Harvesting
- Tractor-Mounted
- Self-Propelled
- Other Equipment
- Mowers
- Windrowers
- Balers
- Region
- Northeast
- Midwest
- Southwest
- Southeast
- West
U.S. AGRICULTURE EQUIPMENT MARKET FAQs
How big is the U.S. agriculture equipment market?
What is the growth rate of the U.S. agriculture equipment market?
What are the significant trends in the U.S. agriculture equipment market?
Which region dominates the U.S. agriculture equipment market share?
Who are the key players in the U.S. agriculture equipment market?
For more details, please reach us at [email protected]
1. SCOPE & COVERAGE
• MARKET DERIVATION
• MARKET DEFINITION
• SEGMENT COVERAGE & DEFINITION
2. PREMIUM INSIGHTS
• OPPORTUNITY POCKET
• KEY MARKET HIGHLIGHTS
• REGIONAL INSIGHTS
3. MARKET DYNAMICS
• OPPORTUNITY & TRENDS
• MARKET ENABLERS
• MARKET RESTRAINTS
• INTRODUCTION
• MARKET LANDSCAPE
4. MARKET SEGMENTATION
• EQUIPMENT TYPE
5. GEOGRAPHICAL SEGMENTATION
• NORTHEAST
• MIDWEST
• SOUTHWEST
• SOUTHEAST
• WEST
6. COMPETITIVE LANDSCAPE
• COMPETITIVE SCENARIO
• MARKET SHARE ANALYSIS
• KEY COMPANY PROFILES
• OTHER PROMINENT COMPANY PROFILES
Select a license type that suits your business needs
Single User Licence
- Report accessible by one user only
- Free 10% or 3 days of customization
- Free post-sale service assistance
- Continuous support through email
5 User Licence
- Report accessible by 5 users within the organization
- Free 15% or 4.5 days of customization
- Continuous support through email and telephone
- Free analyst hour
- Free Upgrade: If an updated report published within 180 days of purchase, you will get the revised report free of charge
Corporate Licence
- Free Datasheet worth $1500
- Report accessible by the entire organization
- Free 20% or 6 days of customization
- Free post-sale service assistance
- Continuous support through email and telephone
- Direct access to lead analysts
- Free analyst hour
- Free Upgrade: If an updated report published within 180 days of purchase, you will get the revised report free of charge
Datasheet Licence
- Report accessible by 1 user only
- Free 15% or 32 hours of customization
- Free post-sale service assistance
- Direct access to lead analysts
Frequently Asked Questions
How big is the U.S. agriculture equipment market?
What is the growth rate of the U.S. agriculture equipment market?
What are the significant trends in the U.S. agriculture equipment market?
Which region dominates the U.S. agriculture equipment market share?
Who are the key players in the U.S. agriculture equipment market?
Other RELATED Reports


Latin America Agriculture Equipment Market - Strategic Assessment & Forecast 2024-2029
Published : August 2024