Interested in Data Center Resources?


more

arrow
CLICK TO EXPLORE

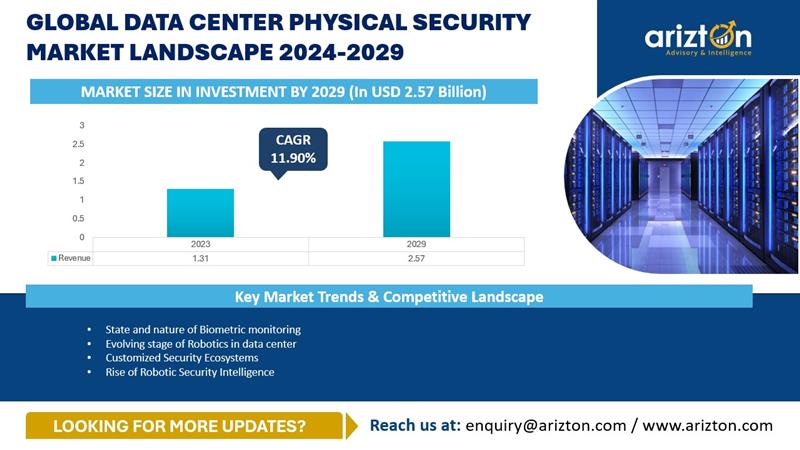
THE GLOBAL DATA CENTER PHYSICAL SECURITY MARKET SIZE WAS VALUED AT USD 1.01 BILLION IN 2022 AND IS EXPECTED TO REACH USD 1.59 BILLION BY 2028, GROWING AT A CAGR OF 7.78%.

The Data Center Physical Security Market Research Report Includes Size, Share, and Growth in Terms of

  • Products: Video Surveillance, Access Control, and Other Physical Security Products
  • Physical Security Layers: Perimeter Security Layer, Building Security, Data Hall Security, and Cabinet Security
  • End Users: Colocation Data Centers, Hyperscale Data Centers, and Enterprise Data Centers
  • Geography: North America, Latin America, Western Europe, Nordics, Central & Eastern Europe, Middle East, Africa, APAC, and Southeast Asia

Industry Analysis Report, Regional Outlook, Growth Potential, Price Trends, Competitive Market Share & Forecast 2023–2028.

Licence Types What are these?
GET ACTIONABLE INSIGHTS ON HOW COVID-19 IS IMPACTING YOUR BUSINESS
Enquire Now Download Free Sample

Most Exhaustive Report

icon-pages

381 Pages

icon-table

82 Tables

icon-chart

208 Charts

icon-region

9 Regions

icon-country

49 Countries

icon-company

38 Companies

icon-market

4 Market Segment

DATA CENTER PHYSICAL SECURITY MARKET REPORT SCOPE

Report Attribute Details
Market Size (2028) USD 1.59 Billion
Market Size (2022) USD 1.01 Billion
CAGR BY REVENUE (2022-2028) 7.78%
Base Year 2022
Forecast Year 2023-2028
Market Segments Products, Physical Security Layers, End Users, and Geography
Geographic Analysis North America, Latin America, Western Europe, Nordics, Central & Eastern Europe, Middle East, Africa, APAC, and Southeast Asia

INDUSTRY OVERVIEW

The global data center physical security market by investment was valued at USD 1.01 billion in 2022 and is expected to reach USD 1.59 billion by 2028, growing at a CAGR of 7.78% during the forecast period. The market has been witnessing growth over the years and is expected to grow even more during the forecasted period. The major factors responsible for the growth include increased data center activities and investment by the hyperscale and colocation operators. The rise in facilities will lead to more and more adoptions of physical security products and propel the data center physical security market growth. There is a direct connection and relationship between the number of data center facilities being developed and the number of physical security products installed. The higher the data center development, the higher the adoption and usage of physical security products.

The exponential increase in the internet-using population across the globe and more remote regions starting to access the internet has led to a colossal level of data generation that needs to be processed and stored. Here is where data centers are crucial in fulfilling these data-driven processes. Such factors have led to the mass-scale construction of data centers in many cities worldwide. A data center facility alone can prompt the need for its physical security and contribute to the growth of the data center physical security market, as data is money and power in today’s age. Protecting data from threats, theft, malfunction, or loss is paramount.

Data Center Physical Security Market Size Report

Importance of Physical Security in Data Centers

In today’s world, where most discussions on security in data centers revolve around cyberattacks, that’s only part of the equation. Data centers must install several physical measures and products that keep these sites secure and safe. The data center physical security market has played a major role as it helps install physical security products that are important in data centers as they reduce the threat of outages, social engineering attacks, insider threats, and others due to installing several layers of physical security.

KEY TRENDS

The State and Nature of Biometric Monitoring
There are several challenges that a data center operator is likely to face while operating a data center. One of the aspects includes ensuring that people who need access can get it while simultaneously keeping unauthorized people out. Using keys and access cards to manage entry into data center facilities was traditionally hard, inefficient, and difficult to scale. Today, a new type of solution, biometrics, disrupts and transforms how operators monitor and secure their facilities. Biometric monitoring uses smart devices that collect biometric data, such as fingerprint readers, facial scanners, body temperature sensors, and others that help operators manage data center facilities.

There have been advancements in video surveillance systems connected to cloud systems, which provide recording, image captures, analytics, and notification services. These cloud-based video cameras upload constantly and need a reliable connection since they do not come with local storage. Cloud-based video analytics has become the latest trend in data center physical security.

The Evolving Stage of Robotics
Industry and the market are witnessing several innovations over a period of time. One of them includes the deployment of robots to monitor the data center facilities. With advancements in Artificial Intelligence (AI) and Machine Learning (ML) by the hour, robots have become more capable of optimizing operations and efficiency in maintaining the vitals of a data center. Apart from the usual inspections and monitoring, it also plays a role in the physical security of a data center and mitigates human intervention, thereby employing fewer people and reducing organizational costs.

SEGMENTATION INSIGHTS

The most optimal and strategic way to secure a data center from a threat or attack is to manage it in several layers. The layers provide a structured pattern of physical protection of critical information and data, thus making it easy to analyze a failure. The outer layers are purely physical, whereas the inner layers help deter deliberate or accidental data breaches. Physical security products like video surveillance, access control, sensors, mantraps, and fences are some of the main solutions that help keep a data center safe from undesirable external factors.

The video surveillance product segment held the most prominent data center physical security market share in 2022. In data centers, these video surveillance systems are installed near entrance gates, access points, and data halls, and some cameras are hosted near the perimeter fencing and gates for monitoring external movements. However, access control systems will likely take over the video surveillance systems by 2028, with a market share of around 35% in 2028.

In the physical security layers segment, the building security segment dominated the data center physical security market and is projected to continue its dominance throughout the forecast period. The building security is the second protection layer after the perimeter layer. Its main purpose is to restrict access further in case of a breach in the perimeter layer.

GEOGRAPHICAL ANALYSIS

Americas Region: Technologically Advanced and Established Markets:
North America leads the data center physical security market in the Americas region, followed by Latin America. North America is considered among the developed and established data center markets and sets the base for other regions like Europe and the APAC region. Latin America is among the emerging and developing data center markets with high potential during the forecast period.

Apac Region: The Most Dynamic and Fastest Growing Markets:

The APAC region is considered among the fastest-growing markets across the globe due to increased digitalization and internet users creating a higher demand for data storage facilities. The region has some of the largest and most established markets, such as China, Singapore, Australia, Japan, Hong Kong, and India. Some emerging markets include Indonesia, Malaysia, South Korea, New Zealand, and Thailand.

Mea Region: The Evolving and Higher Potential Markets:

The MEA region has a higher potential for growth in adopting physical security products. The market witnesses higher physical security breaches compared to other regions. The operators are involved in deploying higher measures of physical security products to reduce unauthorized entry and access into data center buildings. 

Europe Region: Several Established and Booming Markets:

The European region has the presence of several established markets, such as the UK, France, Germany, Ireland, and the Netherlands. The region is also witnessing a boom across other markets such as Spain, Poland, Italy, Belgium, Denmark, Sweden, and other countries. The development of data center facilities will lead to increased adoption of physical security products.

VENDOR LANDSCAPE

  • ASSA ABLOY, BioConnect, Axis Communications, ABB, Bosch Security and Safety Systems, Cisco Systems, Johnson Controls, Boston Dynamics, Honeywell, Siemens, Schneider Electric, and others are some of the prominent providers in the global data center physical security market. For instance, BioConnect provides biometric systems solutions to data center facilities such as Switch, Equinix, CyrusOne, and DataBank.
  • The deployment of Robots into the facilities will likely disrupt the data center physical security market, with Boston Dynamics leading the trend by deploying their robot dogs in many of these companies’ data centers for various purposes like testing, maintenance, monitoring, and other purposes. Companies such as Novva Data Centers, Oracle and semiconductor firms such as GlobalFoundries are deploying the company’s Spot robot dog.
  • Physical security providers are likely to face extreme competition in matured and established markets such as the U.S., Canada, the U.K., China, France, Germany, Singapore, Japan, Ireland, the Netherlands, Brazil, and others due to the presence of several local and global providers. The providers may partner with local providers to offer products in such markets and attain a significant market share. The providers should also continuously innovate their products per the current market trend and demand to stay active in a particular country or region.

Frequently Asked Questions

How big is the data center physical security market?

The global data center physical security market size was valued at USD 1.01 billion in 2022 and is expected to reach USD 1.59 billion by 2028.

What is the growth rate of the global data center physical security market?

The global data center physical security market share is growing at a CAGR of 7.78% from 2022-2028.

What are the key trends in the data center physical security market?

Growing edge data center investments, usage of anti-climb perimeter security, advancements in video and cloud-based analytics, and introduction of robot-driven physical security measures for data centers are some key trends in the data center physical security industry.

WHO ARE THE KEY DATA CENTER PHYSICAL SECURITY MARKET PLAYERS?

Assa Abloy, ABB, BioConnect, Bosch Security Systems, Johnson Controls, and Honeywell.

Download Free Sample

The global data center physical security market is expected to grow at a CAGR of 7.78% from 2022 to 2028.

The following factors are likely to contribute to the growth of the global data center physical security market during the forecast period:

  • Significant Investments in Colocation Data Center Facilities
  • Increase in Hyperscale Investments
  • Increasing Adoption of Multifactor Authentication Solution

Base Year: 2022

Forecast Year: 2023–2028

The study considers the present scenario of the global data center physical security market and its market dynamics for 2023−2028. It covers a detailed overview of several market growth enablers, restraints, and trends. The report offers both the demand and supply aspects of the industry. It profiles and examines leading and prominent companies operating in the industry.

Key Company Profiles

  • ABB
    • Business Overview
    • Product Offerings
  • Alcatraz AI
  • AMAG Technology
  • ASSA ABLOY
  • Axis Communications
  • Barkers Fencing
  • Bayometric
  • Bosch Security and Safety Systems
  • BioConnect
  • Boon Edam
  • Boston Dynamics
  • Cisco Systems
  • Convergint Technologies
  • CLD Physical Security Systems
  • Dahua Technology
  • Digitus Biometrics
  • Eagle Eye Networks
  • Genetec
  • Gunnebo
  • Hangzhou Hikvision Digital Technology (Hikvision)
  • Honeywell
  • Horton Automatics
  • Instor (Accelevation)
  • Johnson Controls
  • Kisi
  • LenelS2 (Carrier)
  • Legrand
  • Pacific Controls
  • Pelco (Motorola Solutions)
  • Puffins Solutions
  • Schneider Electric
  • Secure I.T. Environments
  • Securitas
  • Siemens
  • Southwest Microwave
  • Suprema
  • Verkada
  • WireCrafters

Segmentation by Products

  • Video Surveillance
  • Access Control
  • Other Physical Security Products

Segmentation by Physical Security Layers

  • Perimeter Security Layer
  • Building Security
  • Data Hall Security
  • Cabinet Security

Segmentation by End Users

  • Colocation Data Centers
  • Hyperscale Data Centers
  • Enterprise Data Centers

Segmentation by Geography

  • North America
    • US
    • Canada
  • Latin America
    • Brazil
    • Mexico
    • Chile
    • Colombia
    • Rest of Latin America
  • Western Europe
    • UK
    • Germany
    • France
    • Netherlands
    • Ireland
    • Switzerland
    • Italy
    • Spain
    • Belgium
    • Other Western European Countries
  • Nordics
    • Denmark
    • Sweden
    • Norway
    • Finland & Iceland
  • Central & Eastern Europe
    • Russia
    • Poland
    • Austria
    • Other Central & Eastern European Countries
  • Middle East
    • UAE
    • Saudi Arabia
    • Israel
    • Other Middle East Countries
  • Africa
    • South Africa
    • Kenya
    • Nigeria
    • Other African Countries
  • APAC
    • China
    • Hong Kong
    • Australia
    • New Zealand
    • India
    • Japan
    • South Korea
    • Taiwan
    • Rest of APAC
  • Southeast Asia
    • Singapore
    • Indonesia
    • Malaysia
    • Thailand
    • Philippines
    • Vietnam
    • Other Southeast Asia Countries

1. REPORT COVERAGE
1.1. WHAT’S INCLUDED
1.2. SEGMENTAL COVERAGE
1.2.1. Market Segmentation by Product
1.2.2. Market Segmentation by Physical Security Layer
1.2.3. Market Segmentation by End-user

2. MARKET AT A GLANCE
3. PREMIUM INSIGHTS
3.1. KEY HIGHLIGHTS
3.1.1. Overview of Global Data Center Physical Security Market
3.1.2. Key Trends
3.1.3. Segmental Analysis
3.1.4. Geographical Analysis
3.1.5. Vendor Analysis

4. INTRODUCTION
4.1. MARKET SNAPSHOT
4.2. MARKET OVERVIEW
4.2.1. Data Center Project Lifecycle
4.2.2. Access Control Systems
4.2.3. Physical Security Layers of a Data Center
4.2.4. Best Practices

5. MARKET OPPORTUNITIES & TRENDS
5.1. RISE IN EDGE DATA CENTER INVESTMENTS
5.2. USE OF ANTI-CLIMB PERIMETER SECURITY
5.3. ADVANCES IN VIDEO- & CLOUD-BASED ANALYTICS
5.4. INTRODUCTION OF ROBOT-DRIVEN PHYSICAL SECURITY MEASURES FOR DATA CENTERS

6. MARKET GROWTH ENABLERS
6.1. INVESTMENTS IN COLOCATION DATA CENTER FACILITIES
6.2. INCREASE IN HYPERSCALE INVESTMENTS
6.2.1. AWS
6.2.2. Apple
6.2.3. Google
6.2.4. Meta
6.2.5. Microsoft
6.3. ADOPTION OF MULTI-FACTOR AUTHENTICATION SOLUTIONS

7. MARKET RESTRAINTS
7.1. SECURITY CHALLENGES
7.1.1. Physical Security
7.1.2. Access Control
7.1.3. Surveillance Cameras in Server Rooms
7.1.4. Environmental Hazards
7.2. COST OF PHYSICAL SECURITY SOLUTIONS

8. MARKET LANDSCAPE
8.1. INVESTMENT: MARKET SIZE AND FORECAST

9. MARKET SEGMENTATION BY PRODUCT
9.1. MARKET SNAPSHOT
9.2. KEY HIGHLIGHTS
9.3. MARKET OVERVIEW
9.4. VIDEO SURVEILLANCE
9.4.1. Market Overview
9.4.2. Investment: Market Size & Forecast
9.5. ACCESS CONTROL
9.5.1. Market Overview
9.5.2. Investment: Market Size & Forecast
9.6. OTHER PHYSICAL SECURITY PRODUCTS
9.6.1. Market Overview
9.6.2. Investment: Market Size & Forecast

10. MARKET SEGMENTATION BY PHYSICAL SECURITY LAYER
10.1. MARKET SNAPSHOT
10.2. KEY HIGHLIGHTS
10.3. MARKET OVERVIEW
10.4. PERIMETER SECURITY
10.4.1. Market Overview
10.4.2. Investment: Market Size & Forecast
10.5. BUILDING SECURITY
10.5.1. Market Overview
10.5.2. Investment: Market Size & Forecast
10.6. DATA HALL SECURITY
10.6.1. Market Overview
10.6.2. Investment: Market Size & Forecast
10.7. CABINET SECURITY
10.7.1. Market Overview
10.7.2. Investment: Market Size & Forecast

11. MARKET SEGMENTATION BY END-USER
11.1. MARKET SNAPSHOT
11.2. KEY HIGHLIGHTS
11.3. MARKET OVERVIEW
11.4. COLOCATION DATA CENTERS
11.4.1. Market Overview
11.4.2. Investment: Market Size & Forecast
11.5. HYPERSCALE DATA CENTERS
11.5.1. Market Overview
11.5.2. Investment: Market Size & Forecast
11.6. ENTERPRISE DATA CENTERS
11.6.1. Market Overview
11.6.2. Investment: Market Size & Forecast

12. NORTH AMERICA
12.1. Market Overview
12.2. Investment: Market Size & Forecast
12.3. Product: Market Size & Forecast
12.4. US
12.4.1. Market Overview
12.4.2. Investment: Market Size & Forecast
12.4.3. Product: Market Size & Forecast
12.5. CANADA
12.5.1. Market Overview
12.5.2. Investment: Market Size & Forecast
12.5.3. Product: Market Size & Forecast

13. LATIN AMERICA
13.1. Market Overview
13.2. Investment: Market Size & Forecast
13.3. Product: Market Size & Forecast
13.4. BRAZIL
13.4.1. Market Overview
13.4.2. Investment: Market Size & Forecast
13.4.3. Product: Market Size & Forecast
13.5. MEXICO
13.5.1. Market Overview
13.5.2. Investment: Market Size & Forecast
13.5.3. Product: Market Size & Forecast
13.6. CHILE
13.6.1. Market Overview
13.6.2. Investment: Market Size & Forecast
13.6.3. Product: Market Size & Forecast
13.7. COLOMBIA
13.7.1. Market Overview
13.7.2. Investment: Market Size & Forecast
13.7.3. Product: Market Size & Forecast
13.8. REST OF LATIN AMERICA
13.8.1. Market Overview
13.8.2. Investment: Market Size & Forecast
13.8.3. Product: Market Size & Forecast

14. WESTERN EUROPE
14.1. Market Overview
14.2. Investment: Market Size & Forecast
14.3. Product: Market Size & Forecast
14.4. UK
14.4.1. Market Overview
14.4.2. Investment: Market Size & Forecast
14.4.3. Product: Market Size & Forecast
14.5. GERMANY
14.5.1. Market Overview
14.5.2. Investment: Market Size & Forecast
14.5.3. Product: Market Size & Forecast
14.6. FRANCE
14.6.1. Market Overview
14.6.2. Investment: Market Size & Forecast
14.6.3. Product: Market Size & Forecast
14.7. NETHERLANDS
14.7.1. Market Overview
14.7.2. Investment: Market Size & Forecast
14.7.3. Product: Market Size & Forecast
14.8. IRELAND
14.8.1. Market Overview
14.8.2. Investment: Market Size & Forecast
14.8.3. Product: Market Size & Forecast
14.9. SWITZERLAND
14.9.1. Market Overview
14.9.2. Investment: Market Size & Forecast
14.9.3. Product: Market Size & Forecast
14.10. ITALY
14.10.1. Market Overview
14.10.2. Investment: Market Size & Forecast
14.10.3. Product: Market Size & Forecast
14.11. SPAIN
14.11.1. Market Overview
14.11.2. Investment: Market Size & Forecast
14.11.3. Product: Market Size & Forecast
14.12. BELGIUM
14.12.1. Market Overview
14.12.2. Investment: Market Size & Forecast
14.12.3. Product: Market Size & Forecast
14.13. OTHER WESTERN EUROPEAN COUNTRIES
14.13.1. Market Overview
14.13.2. Investment: Market Size & Forecast
14.13.3. Product: Market Size & Forecast

15. NORDICS
15.1. Market Overview
15.2. Investment: Market Size & Forecast
15.3. Product: Market Size & Forecast
15.4. DENMARK
15.4.1. Market Overview
15.4.2. Investment: Market Size & Forecast
15.4.3. Product: Market Size & Forecast
15.5. SWEDEN
15.5.1. Market Overview
15.5.2. Investment: Market Size & Forecast
15.5.3. Product: Market Size & Forecast
15.6. NORWAY
15.6.1. Market Overview
15.6.2. Investment: Market Size & Forecast
15.6.3. Product: Market Size & Forecast
15.7. FINLAND & ICELAND
15.7.1. Market Overview
15.7.2. Investment: Market Size & Forecast
15.7.3. Product: Market Size & Forecast

16. CENTRAL & EASTERN EUROPE
16.1. Market Overview
16.2. Investment: Market Size & Forecast
16.3. Product: Market Size & Forecast
16.4. RUSSIA
16.4.1. Market Overview
16.4.2. Investment: Market Size & Forecast
16.4.3. Product: Market Size & Forecast
16.5. POLAND
16.5.1. Market Overview
16.5.2. Investment: Market Size & Forecast
16.5.3. Product: Market Size & Forecast
16.6. AUSTRIA
16.6.1. Market Overview
16.6.2. Investment: Market Size & Forecast
16.6.3. Product: Market Size & Forecast
16.7. OTHER CENTRAL & EASTERN EUROPEAN COUNTRIES
16.7.1. Market Overview
16.7.2. Investment: Market Size & Forecast
16.7.3. Product: Market Size & Forecast

17. MIDDLE EAST
17.1. Market Overview
17.2. Investment: Market Size & Forecast
17.3. Product: Market Size & Forecast
17.4. UAE
17.4.1. Market Overview
17.4.2. Investment: Market Size & Forecast
17.4.3. Product: Market Size & Forecast
17.5. SAUDI ARABIA
17.5.1. Market Overview
17.5.2. Investment: Market Size & Forecast
17.5.3. Product: Market Size & Forecast
17.6. ISRAEL
17.6.1. Market Overview
17.6.2. Investment: Market Size & Forecast
17.6.3. Product: Market Size & Forecast
17.7. OTHER MIDDLE EASTERN COUNTRIES
17.7.1. Market Overview
17.7.2. Investment: Market Size & Forecast
17.7.3. Product: Market Size & Forecast

18. AFRICA
18.1. Market Overview
18.2. Investment: Market Size & Forecast
18.3. Product: Market Size & Forecast
18.4. SOUTH AFRICA
18.4.1. Market Overview
18.4.2. Investment: Market Size & Forecast
18.4.3. Product: Market Size & Forecast
18.5. KENYA
18.5.1. Market Overview
18.5.2. Investment: Market Size & Forecast
18.5.3. Product: Market Size & Forecast
18.6. NIGERIA
18.6.1. Market Overview
18.6.2. Investment: Market Size & Forecast
18.6.3. Product: Market Size & Forecast
18.7. OTHER AFRICAN COUNTRIES
18.7.1. Market Overview
18.7.2. Investment: Market Size & Forecast
18.7.3. Product: Market Size & Forecast

19. APAC
19.1. Market Overview
19.2. Investment: Market Size & Forecast
19.3. Product: Market Size & Forecast
19.4. CHINA
19.4.1. Market Overview
19.4.2. Investment: Market Size & Forecast
19.4.3. Product: Market Size & Forecast
19.5. HONG KONG
19.5.1. Market Overview
19.5.2. Investment: Market Size & Forecast
19.5.3. Product: Market Size & Forecast
19.6. AUSTRALIA
19.6.1. Market Overview
19.6.2. Investment: Market Size & Forecast
19.6.3. Product: Market Size & Forecast
19.7. NEW ZEALAND
19.7.1. Market Overview
19.7.2. Investment: Market Size & Forecast
19.7.3. Product: Market Size & Forecast
19.8. INDIA
19.8.1. Market Overview
19.8.2. Investment: Market Size & Forecast
19.8.3. Product: Market Size & Forecast
19.9. JAPAN
19.9.1. Market Overview
19.9.2. Investment: Market Size & Forecast
19.9.3. Product: Market Size & Forecast
19.10. SOUTH KOREA
19.10.1. Market Overview
19.10.2. Investment: Market Size & Forecast
19.10.3. Product: Market Size & Forecast
19.11. TAIWAN
19.11.1. Market Overview
19.11.2. Investment: Market Size & Forecast
19.11.3. Product: Market Size & Forecast
19.12. REST OF APAC
19.12.1. Market Overview
19.12.2. Investment: Market Size & Forecast
19.12.3. Product: Market Size & Forecast

20. SOUTHEAST ASIA
20.1. Market Overview
20.2. Investment: Market Size & Forecast
20.3. Product: Market Size & Forecast
20.4. SINGAPORE
20.4.1. Market Overview
20.4.2. Investment: Market Size & Forecast
20.4.3. Product: Market Size & Forecast
20.5. INDONESIA
20.5.1. Market Overview
20.5.2. Investment: Market Size & Forecast
20.5.3. Product: Market Size & Forecast
20.6. MALAYSIA
20.6.1. Market Overview
20.6.2. Investment: Market Size & Forecast
20.6.3. Product: Market Size & Forecast
20.7. THAILAND
20.7.1. Market Overview
20.7.2. Investment: Market Size & Forecast
20.7.3. Product: Market Size & Forecast
20.8. PHILIPPINES
20.8.1. Market Overview
20.8.2. Investment: Market Size & Forecast
20.8.3. Product: Market Size & Forecast
20.9. VIETNAM
20.9.1. Market Overview
20.9.2. Investment: Market Size & Forecast
20.9.3. Product: Market Size & Forecast
20.10. OTHER SOUTHEAST ASIAN COUNTRIES
20.10.1. Market Overview
20.10.2. Investment: Market Size & Forecast
20.10.3. Product: Market Size & Forecast

21. COMPETITIVE LANDSCAPE
21.1. COMPETITION OVERVIEW

22. KEY COMPANY PROFILES
22.1. ABB
22.1.1. Business Overview
22.1.2. Product Offerings
22.2. ALCATRAZ AI
22.2.1. Business Overview
22.2.2. Product Offerings
22.3. AMAG TECHNOLOGY
22.3.1. Business Overview
22.3.2. Product Offerings
22.4. ASSA ABLOY
22.4.1. Business Overview
22.4.2. Product Offerings
22.5. AXIS COMMUNICATIONS
22.5.1. Business Overview
22.5.2. Product Offerings
22.6. BARKERS FENCING
22.6.1. Business Overview
22.6.2. Product Offerings
22.7. BAYOMETRIC
22.7.1. Business Overview
22.7.2. Product Offerings
22.8. BOSCH SECURITY AND SAFETY SYSTEMS
22.8.1. Business Overview
22.8.2. Product Offerings
22.9. BIOCONNECT
22.9.1. Business Overview
22.9.2. Product Offerings
22.10. BOON EDAM
22.10.1. Business Overview
22.10.2. Product Offerings
22.11. BOSTON DYNAMICS
22.11.1. Business Overview
22.11.2. Product Offerings
22.12. CISCO SYSTEMS
22.12.1. Business Overview
22.12.2. Product Offerings
22.13. CONVERGINT TECHNOLOGIES
22.13.1. Business Overview
22.13.2. Product Offerings
22.14. CLD PHYSICAL SECURITY SYSTEMS
22.14.1. Business Overview
22.14.2. Product Offerings
22.15. DAHUA TECHNOLOGY
22.15.1. Business Overview
22.15.2. Product Offerings
22.16. DIGITUS BIOMETRICS
22.16.1. Business Overview
22.16.2. Product Offerings
22.17. EAGLE EYE NETWORKS
22.17.1. Business Overview
22.17.2. Product Offerings
22.18. GENETEC
22.18.1. Business Overview
22.18.2. Product Offerings
22.19. GUNNEBO
22.19.1. Business Overview
22.19.2. Product Offerings
22.20. HANGZHOU HIKVISION DIGITAL TECHNOLOGY (HIKVISION)
22.20.1. Business Overview
22.20.2. Product Offerings
22.21. HONEYWELL
22.21.1. Business Overview
22.21.2. Product Offerings
22.22. HORTON AUTOMATICS
22.22.1. Business Overview
22.22.2. Product Offerings
22.23. INSTOR (ACCELEVATION)
22.23.1. Business Overview
22.23.2. Product Offerings
22.24. JOHNSON CONTROLS
22.24.1. Business Overview
22.24.2. Product Offerings
22.25. KISI
22.25.1. Business Overview
22.25.2. Product Offerings
22.26. LENELS2 (CARRIER)
22.26.1. Business Overview
22.26.2. Product Offerings
22.27. LEGRAND
22.27.1. Business Overview
22.27.2. Product Offerings
22.28. PACIFIC CONTROLS
22.28.1. Business Overview
22.28.2. Product Offerings
22.29. PELCO (MOTOROLA SOLUTIONS)
22.29.1. Business Overview
22.29.2. Product Offerings
22.30. PUFFINS SOLUTIONS
22.30.1. Business Overview
22.30.2. Product Offerings
22.31. SCHNEIDER ELECTRIC
22.31.1. Business Overview
22.31.2. Product Offerings
22.32. SECURE I.T. ENVIRONMENTS
22.32.1. Business Overview
22.32.2. Product Offerings
22.33. SECURITAS
22.33.1. Business Overview
22.33.2. Product Offerings
22.34. SIEMENS
22.34.1. Business Overview
22.34.2. Product Offerings
22.35. SOUTHWEST MICROWAVE
22.35.1. Business Overview
22.35.2. Product Offerings
22.36. SUPREMA
22.36.1. Business Overview
22.36.2. Product Offerings
22.37. VERKADA
22.37.1. Business Overview
22.37.2. Product Offerings
22.38. WIRECRAFTERS
22.38.1. Business Overview
22.38.2. Product Offerings

23. QUANTITATIVE SUMMARY
23.1. GLOBAL DATA CENTER PHYSICAL SECURITY MARKET
23.1.1. Market Size & Forecast
23.2. PRODUCT
23.2.1. Market Size & Forecast
23.3. PHYSICAL SECURITY LAYER
23.3.1. Market Size & Forecast
23.4. END-USER
23.4.1. Market Size & Forecast
23.5. INVESTMENT BY GEOGRAPHY
23.5.1. Market Size & Forecast
23.6. NORTH AMERICA
23.6.1. Market Size & Forecast
23.7. US
23.7.1. Market Size & Forecast
23.8. CANADA
23.8.1. Market Size & Forecast
23.9. LATIN AMERICA
23.9.1. Market Size & Forecast
23.10. BRAZIL
23.10.1. Market Size & Forecast
23.11. MEXICO
23.11.1. Market Size & Forecast
23.12. CHILE
23.12.1. Market Size & Forecast
23.13. COLOMBIA
23.13.1. Market Size & Forecast
23.14. REST OF LATIN AMERICA
23.14.1. Market Size & Forecast
23.15. WESTERN EUROPE
23.15.1. Market Size & Forecast
23.16. UK
23.16.1. Market Size & Forecast
23.17. FRANCE
23.17.1. Market Size & Forecast
23.18. GERMANY
23.18.1. Market Size & Forecast
23.19. NETHERLANDS
23.19.1. Market Size & Forecast
23.20. IRELAND
23.20.1. Market Size & Forecast
23.21. SWITZERLAND
23.21.1. Market Size & Forecast
23.22. ITALY
23.22.1. Market Size & Forecast
23.23. SPAIN
23.23.1. Market Size & Forecast
23.24. BELGIUM
23.24.1. Market Size & Forecast
23.25. OTHER WESTERN EUROPEAN COUNTRIES
23.25.1. Market Size & Forecast
23.26. NORDICS
23.26.1. Market Size & Forecast
23.27. DENMARK
23.27.1. Market Size & Forecast
23.28. SWEDEN
23.28.1. Market Size & Forecast
23.29. NORWAY
23.29.1. Market Size & Forecast
23.30. FINLAND & ICELAND
23.30.1. Market Size & Forecast
23.31. CENTRAL & EASTERN EUROPEAN COUNTRIES
23.31.1. Market Size & Forecast
23.32. RUSSIA
23.32.1. Market Size & Forecast
23.33. POLAND
23.33.1. Market Size & Forecast
23.34. AUSTRIA
23.34.1. Market Size & Forecast
23.35. OTHER CENTRAL & EASTERN EUROPEAN COUNTRIES
23.35.1. Market Size & Forecast
23.36. MIDDLE EAST
23.36.1. Market Size & Forecast
23.37. UAE
23.37.1. Market Size & Forecast
23.38. SAUDI ARABIA
23.38.1. Market Size & Forecast
23.39. ISRAEL
23.39.1. Market Size & Forecast
23.40. OTHER MIDDLE EASTERN COUNTRIES
23.40.1. Market Size & Forecast
23.41. AFRICA
23.41.1. Market Size & Forecast
23.42. SOUTH AFRICA
23.42.1. Market Size & Forecast
23.43. KENYA
23.43.1. Market Size & Forecast
23.44. NIGERIA
23.44.1. Market Size & Forecast
23.45. OTHER AFRICAN COUNTRIES
23.45.1. Market Size & Forecast
23.46. APAC
23.46.1. Market Size & Forecast
23.47. CHINA
23.47.1. Market Size & Forecast
23.48. HONG KONG
23.48.1. Market Size & Forecast
23.49. AUSTRALIA
23.49.1. Market Size & Forecast
23.50. NEW ZEALAND
23.50.1. Market Size & Forecast
23.51. INDIA
23.51.1. Market Size & Forecast
23.52. JAPAN
23.52.1. Market Size & Forecast
23.53. SOUTH KOREA
23.53.1. Market Size & Forecast
23.54. TAIWAN
23.54.1. Market Size & Forecast
23.55. REST OF APAC
23.55.1. Market Size & Forecast
23.56. SOUTHEAST ASIA
23.56.1. Market Size & Forecast
23.57. SINGAPORE
23.57.1. Market Size & Forecast
23.58. INDONESIA
23.58.1. Market Size & Forecast
23.59. MALAYSIA
23.59.1. Market Size & Forecast
23.60. THAILAND
23.60.1. Market Size & Forecast
23.61. PHILIPPINES
23.61.1. Market Size & Forecast
23.62. VIETNAM
23.62.1. Market Size & Forecast
23.63. OTHER SOUTHEAST ASIAN COUNTRIES
23.63.1. Market Size & Forecast

24. APPENDIX
24.1. LIST OF ABBREVIATIONS
24.2. CURRENCY CONVERSION

LIST OF EXHIBITS

Exhibit 1: Market Derivation
Exhibit 2: Historical vs. Present Global Data Center Physical Security Market (2021 & 2022)
Exhibit 3: Global Data Center Physical Security Market Segmental Analysis by Product
Exhibit 4: Global Data Center Physical Security Market Investment Share by Geography (2022)
Exhibit 5: Global Data Center Physical Security Market Snapshot
Exhibit 6: Data Center Project Lifecycle
Exhibit 7: Access Control Credential Types
Exhibit 8: Four Layers of Data Center Physical Security
Exhibit 9: Global Data Center Physical Security Market by Investment 2022–2028 ($ million)
Exhibit 10: Market Snapshot ($ million)
Exhibit 11: Overview of Global Data Center Physical Security Market by Product
Exhibit 12: Global Data Center Physical Security Market by Video Surveillance 2022–2028 ($ million)
Exhibit 13: Global Data Center Physical Security Market by Access Control 2022–2028 ($ million)
Exhibit 14: Global Data Center Physical Security Market by Other Physical Security Products 2022–2028 ($ million)
Exhibit 15: Market Snapshot ($ million)
Exhibit 16: Overview of Global Data Center Physical Security Market by Physical Security Layer
Exhibit 17: Global Data Center Physical Security Market by Perimeter Security 2022–2028 ($ million)
Exhibit 18: Global Data Center Physical Security Market by Building Security 2022–2028 ($ million)
Exhibit 19: Global Data Center Physical Security Market by Data Hall Security 2022–2028 ($ million)
Exhibit 20: Global Data Center Physical Security Market by Cabinet Security 2022–2028 ($ million)
Exhibit 21: Market Snapshot($ million)
Exhibit 22: Overview of Global Data Center Physical Security Market by End-user
Exhibit 23: Global Data Center Physical Security Market by Colocation Data Centers 2022–2028 ($ million)
Exhibit 24: Global Data Center Physical Security Market by Hyperscale Data Centers 2022–2028 ($ million)
Exhibit 25: Global Data Center Physical Security Market by Enterprise Data Centers 2022–2028 ($ million)
Exhibit 26: North America Data Center Physical Security Market Overview ($ million)
Exhibit 27: North America Data Center Physical Security Market by Geography (2022)
Exhibit 28: North America Data Center Physical Security Market by Investment 2022–2028 ($ million)
Exhibit 29: North America Data Center Physical Security Market by Product 2022–2028 ($ million)
Exhibit 30: US Data Center Physical Security Market Overview ($ million)
Exhibit 31: US Data Center Physical Security Market by Investment 2022–2028 ($ million)
Exhibit 32: US Data Center Physical Security Market by Product 2022–2028 ($ million)
Exhibit 33: Canada Data Center Physical Security Market Overview ($ million)
Exhibit 34: Canada Data Center Physical Security Market by Investment 2022–2028 ($ million)
Exhibit 35: Canada Data Center Physical Security Market by Product 2022–2028 ($ million)
Exhibit 36: Latin America Data Center Physical Security Market Overview ($ million)
Exhibit 37: Latin America Data Center Physical Security Market by Geography (2022)
Exhibit 38: Latin America Data Center Physical Security Market by Investment 2022–2028 ($ million)
Exhibit 39: Latin America Data Center Physical Security Market by Product 2022–2028 ($ million)
Exhibit 40: Brazil Data Center Physical Security Market Overview ($ million)
Exhibit 41: Brazil Data Center Physical Security Market by Investment 2022–2028 ($ million)
Exhibit 42: Brazil Data Center Physical Security Market by Product 2022–2028 ($ million)
Exhibit 43: Mexico Data Center Physical Security Market Overview ($ million)
Exhibit 44: Mexico Data Center Physical Security Market by Investment 2022–2028 ($ million)
Exhibit 45: Mexico Data Center Physical Security Market by Product 2022–2028 ($ million)
Exhibit 46: Chile Data Center Physical Security Market Overview ($ million)
Exhibit 47: Chile Data Center Physical Security Market by Investment 2022–2028 ($ million)
Exhibit 48: Chile Data Center Physical Security Market by Product 2022–2028 ($ million)
Exhibit 49: Colombia Data Center Physical Security Market Overview ($ million)
Exhibit 50: Colombia Data Center Physical Security Market by Investment 2022–2028 ($ million)
Exhibit 51: Colombia Data Center Physical Security Market by Product 2022–2028 ($ million)
Exhibit 52: Rest of Latin America Data Center Physical Security Market Overview ($ million)
Exhibit 53: Rest of Latin America Data Center Physical Security Market by Investment 2022–2028 ($ million)
Exhibit 54: Rest of Latin America Data Center Physical Security Market by Product 2022–2028 ($ million)
Exhibit 55: Western Europe Data Center Physical Security Market Overview ($ million)
Exhibit 56: Western Europe Data Center Physical Security Market by Geography (2022)
Exhibit 57: Western Europe Data Center Physical Security Market by Investment 2022–2028 ($ million)
Exhibit 58: Western Europe Data Center Physical Security Market by Product 2022–2028 ($ million)
Exhibit 59: UK Data Center Physical Security Market Overview ($ million)
Exhibit 60: UK Data Center Physical Security Market by Investment 2022–2028 ($ million)
Exhibit 61: UK Data Center Physical Security Market by Product 2022–2028 ($ million)
Exhibit 62: Germany Data Center Physical Security Market Overview ($ million)
Exhibit 63: Germany Data Center Physical Security Market by Investment 2022–2028 ($ million)
Exhibit 64: Germany Data Center Physical Security Market by Product 2022–2028 ($ million)
Exhibit 65: France Data Center Physical Security Market Overview ($ million)
Exhibit 66: France Data Center Physical Security Market by Investment 2022–2028 ($ million)
Exhibit 67: France Data Center Physical Security Market by Product 2022–2028 ($ million)
Exhibit 68: Netherlands Data Center Physical Security Market Overview ($ million)
Exhibit 69: Netherlands Data Center Physical Security Market by Investment 2022–2028 ($ million)
Exhibit 70: Netherlands Data Center Physical Security Market by Product 2022–2028 ($ million)
Exhibit 71: Ireland Data Center Physical Security Market Overview ($ million)
Exhibit 72: Ireland Data Center Physical Security Market by Investment 2022–2028 ($ million)
Exhibit 73: Ireland Data Center Physical Security Market by Product 2022–2028 ($ million)
Exhibit 74: Switzerland Data Center Physical Security Market Overview ($ million)
Exhibit 75: Switzerland Data Center Physical Security Market by Investment 2022–2028 ($ million)
Exhibit 76: Switzerland Data Center Physical Security Market by Product 2022–2028 ($ million)
Exhibit 77: Italy Data Center Physical Security Market Overview ($ million)
Exhibit 78: Italy Data Center Physical Security Market by Investment 2022–2028 ($ million)
Exhibit 79: Italy Data Center Physical Security Market by Product 2022–2028 ($ million)
Exhibit 80: Spain Data Center Physical Security Market Overview ($ million)
Exhibit 81: Spain Data Center Physical Security Market by Investment 2022–2028 ($ million)
Exhibit 82: Spain Data Center Physical Security Market by Product 2022–2028 ($ million)
Exhibit 83: Belgium Data Center Physical Security Market Overview ($ million)
Exhibit 84: Belgium Data Center Physical Security Market by Investment 2022–2028 ($ million)
Exhibit 85: Belgium Data Center Physical Security Market by Product 2022–2028 ($ million)
Exhibit 86: Other Western European Countries Data Center Physical Security Market Overview ($ million)
Exhibit 87: Other Western European Countries Data Center Physical Security Market by Investment 2022–2028 ($ million)
Exhibit 88: Other Western European Countries Data Center Physical Security Market by Product 2022–2028 ($ million)
Exhibit 89: Nordics Data Center Physical Security Market Overview ($ million)
Exhibit 90: Nordics Data Center Physical Security Market by Geography (2022)
Exhibit 91: Nordics Data Center Physical Security Market by Investment 2022–2028 ($ million)
Exhibit 92: Nordics Data Center Physical Security Market by Product 2022–2028 ($ million)
Exhibit 93: Denmark Data Center Physical Security Market Overview ($ million)
Exhibit 94: Denmark Data Center Physical Security Market by Investment 2022–2028 ($ million)
Exhibit 95: Denmark Data Center Physical Security Market by Product 2022–2028 ($ million)
Exhibit 96: Sweden Data Center Physical Security Market Overview ($ million)
Exhibit 97: Sweden Data Center Physical Security Market by Investment 2022–2028 ($ million)
Exhibit 98: Sweden Data Center Physical Security Market by Product 2022–2028 ($ million)
Exhibit 99: Norway Data Center Physical Security Market Overview ($ million)
Exhibit 100: Norway Data Center Physical Security Market by Investment 2022–2028 ($ million)
Exhibit 101: Norway Data Center Physical Security Market by Product 2022–2028 ($ million)
Exhibit 102: Finland & Iceland Data Center Physical Security Market Overview ($ million)
Exhibit 103: Finland & Iceland Data Center Physical Security Market by Investment 2022–2028 ($ million)
Exhibit 104: Finland & Iceland Data Center Physical Security Market by Product 2022–2028 ($ million)
Exhibit 105: Central & Eastern Europe Data Center Physical Security Market Overview ($ million)
Exhibit 106: Central & Eastern Europe Data Center Physical Security Market by Geography (2022)
Exhibit 107: Central & Eastern Europe Data Center Physical Security Market by Investment 2022–2028 ($ million)
Exhibit 108: Central & Eastern Europe Data Center Physical Security Market by Product 2022–2028 ($ million)
Exhibit 109: Russia Data Center Physical Security Market Overview ($ million)
Exhibit 110: Russia Data Center Physical Security Market by Investment 2022–2028 ($ million)
Exhibit 111: Russia Data Center Physical Security Market by Product 2022–2028 ($ million)
Exhibit 112: Poland Data Center Physical Security Market Overview ($ million)
Exhibit 113: Poland Data Center Physical Security Market by Investment 2022–2028 ($ million)
Exhibit 114: Poland Data Center Physical Security Market by Product 2022–2028 ($ million)
Exhibit 115: Austria Data Center Physical Security Market Overview ($ million)
Exhibit 116: Austria Data Center Physical Security Market by Investment 2022–2028 ($ million)
Exhibit 117: Austria Data Center Physical Security Market by Product 2022–2028 ($ million)
Exhibit 118: Other Central & Eastern European Countries Data Center Physical Security Market Overview ($ million)
Exhibit 119: Other Central & Eastern European Countries Data Center Physical Security Market by Investment 2022–2028 ($ million)
Exhibit 120: Data Center Physical Security Market in Other Central & Eastern European Countries by Product 2022–2028 ($ million)
Exhibit 121: Middle East Data Center Physical Security Market Overview ($ million)
Exhibit 122: Middle East Data Center Physical Security Market by Geography (2022)
Exhibit 123: Middle East Data Center Physical Security Market by Investment 2022–2028 ($ million)
Exhibit 124: Middle East Data Center Physical Security Market by Product 2022–2028 ($ million)
Exhibit 125: UAE Data Center Physical Security Market Overview ($ million)
Exhibit 126: UAE Data Center Physical Security Market by Investment 2022–2028 ($ million)
Exhibit 127: UAE Data Center Physical Security Market by Product 2022–2028 ($ million)
Exhibit 128: Saudi Arabia Data Center Physical Security Market Overview ($ million)
Exhibit 129: Saudi Arabia Data Center Physical Security Market by Investment 2022–2028 ($ million)
Exhibit 130: Saudi Arabia Data Center Physical Security Market by Product 2022–2028 ($ million)
Exhibit 131: Israel Data Center Physical Security Market Overview ($ million)
Exhibit 132: Israel Data Center Physical Security Market by Investment 2022–2028 ($ million)
Exhibit 133: Israel Data Center Physical Security Market by Product 2022–2028 ($ million)
Exhibit 134: Other Middle Eastern Countries Data Center Physical Security Market Overview ($ million)
Exhibit 135: Other Middle East Countries Data Center Physical Security Market by Investment 2022–2028 ($ million)
Exhibit 136: Other Middle East Countries Data Center Physical Security Market by Product 2022–2028 ($ million)
Exhibit 137: Africa Data Center Physical Security Market Overview ($ million)
Exhibit 138: Africa Data Center Physical Security Market by Geography (2022)
Exhibit 139: Africa Data Center Physical Security Market by Investment 2022–2028 ($ million)
Exhibit 140: Africa Data Center Physical Security Market by Product 2022–2028 ($ million)
Exhibit 141: South Africa Data Center Physical Security Market Overview ($ million)
Exhibit 142: South Africa Data Center Physical Security Market by Investment 2022–2028 ($ million)
Exhibit 143: South Africa Data Center Physical Security Market by Product 2022–2028 ($ million)
Exhibit 144: Kenya Data Center Physical Security Market Overview ($ million)
Exhibit 145: Kenya Data Center Physical Security Market by Investment 2022–2028 ($ million)
Exhibit 146: Kenya Data Center Physical Security Market by Product 2022–2028 ($ million)
Exhibit 147: Nigeria Data Center Physical Security Market Overview ($ million)
Exhibit 148: Nigeria Data Center Physical Security Market by Investment 2022–2028 ($ million)
Exhibit 149: Nigeria Data Center Physical Security Market by Product 2022–2028 ($ million)
Exhibit 150: Other African Countries Data Center Physical Security Market Overview ($ million)
Exhibit 151: Other African Countries Data Center Physical Security Market by Investment 2022–2028 ($ million)
Exhibit 152: Other African Countries Data Center Physical Security Market by Product 2022–2028 ($ million)
Exhibit 153: APAC Data Center Physical Security Market Overview ($ million)
Exhibit 154: APAC Data Center Physical Security Market by Geography (2022)
Exhibit 155: APAC Data Center Physical Security Market by Investment 2022–2028 ($ million)
Exhibit 156: APAC Data Center Physical Security Market by Product 2022–2028 ($ million)
Exhibit 157: China Data Center Physical Security Market Overview ($ million)
Exhibit 158: China Data Center Physical Security Market by Investment 2022–2028 ($ million)
Exhibit 159: China Data Center Physical Security Market by Product 2022–2028 ($ million)
Exhibit 160: Hong Kong Data Center Physical Security Market Overview ($ million)
Exhibit 161: Hong Kong Data Center Physical Security Market by Investment 2022–2028 ($ million)
Exhibit 162: Hong Kong Data Center Physical Security Market by Product 2022–2028 ($ million)
Exhibit 163: Australia Data Center Physical Security Market Overview ($ million)
Exhibit 164: Australia Data Center Physical Security Market by Investment 2022–2028 ($ million)
Exhibit 165: Australia Data Center Physical Security Market by Product 2022–2028 ($ million)
Exhibit 166: New Zealand Data Center Physical Security Market Overview ($ million)
Exhibit 167: New Zealand Data Center Physical Security Market by Investment 2022–2028 ($ million)
Exhibit 168: New Zealand Data Center Physical Security Market by Product 2022–2028 ($ million)
Exhibit 169: India Data Center Physical Security Market Overview ($ million)
Exhibit 170: India Data Center Physical Security Market by Investment 2022–2028 ($ million)
Exhibit 171: India Data Center Physical Security Market by Product 2022–2028 ($ million)
Exhibit 172: Japan Data Center Physical Security Market Overview ($ million)
Exhibit 173: Japan Data Center Physical Security Market by Investment 2022–2028 ($ million)
Exhibit 174: Japan Data Center Physical Security Market by Product 2022–2028 ($ million)
Exhibit 175: South Korea Data Center Physical Security Market Overview ($ million)
Exhibit 176: South Korea Data Center Physical Security Market by Investment 2022–2028 ($ million)
Exhibit 177: South Korea Data Center Physical Security Market by Product 2022–2028 ($ million)
Exhibit 178: Taiwan Data Center Physical Security Market Overview ($ million)
Exhibit 179: Taiwan Data Center Physical Security Market by Investment 2022–2028 ($ million)
Exhibit 180: Taiwan Data Center Physical Security Market by Product 2022–2028 ($ million)
Exhibit 181: Rest of APAC Data Center Physical Security Market Overview ($ million)
Exhibit 182: Rest of APAC Data Center Physical Security Market by Investment 2022–2028 ($ million)
Exhibit 183: Rest of APAC Data Center Physical Security Market by Product 2022–2028 ($ million)
Exhibit 184: Southeast Asia Data Center Physical Security Market Overview ($ million)
Exhibit 185: Southeast Asia Data Center Physical Security Market by Geography (2022)
Exhibit 186: Southeast Asia Data Center Physical Security Market by Investment 2022–2028 ($ million)
Exhibit 187: Southeast Asia Data Center Physical Security Market by Product 2022–2028 ($ million)
Exhibit 188: Singapore Data Center Physical Security Market Overview ($ million)
Exhibit 189: Singapore Data Center Physical Security Market by Investment 2022–2028 ($ million)
Exhibit 190: Singapore Data Center Physical Security Market by Product 2022–2028 ($ million)
Exhibit 191: Indonesia Data Center Physical Security Market Overview ($ million)
Exhibit 192: Indonesia Data Center Physical Security Market by Investment 2022–2028 ($ million)
Exhibit 193: Indonesia Data Center Physical Security Market by Product 2022–2028 ($ million)
Exhibit 194: Malaysia Data Center Physical Security Market Overview ($ million)
Exhibit 195: Malaysia Data Center Physical Security Market by Investment 2022–2028 ($ million)
Exhibit 196: Malaysia Data Center Physical Security Market by Product 2022–2028 ($ million)
Exhibit 197: Thailand Data Center Physical Security Market Overview ($ million)
Exhibit 198: Thailand Data Center Physical Security Market by Investment 2022–2028 ($ million)
Exhibit 199: Thailand Data Center Physical Security Market by Product 2022–2028 ($ million)
Exhibit 200: Philippines Data Center Physical Security Market Overview ($ million)
Exhibit 201: Philippines Data Center Physical Security Market by Investment 2022–2028 ($ million)
Exhibit 202: Philippines Data Center Physical Security Market by Product 2022–2028 ($ million)
Exhibit 203: Vietnam Data Center Physical Security Market Overview ($ million)
Exhibit 204: Vietnam Data Center Physical Security Market by Investment 2022–2028 ($million)
Exhibit 205: Vietnam Data Center Physical Security Market by Product 2022–2028 ($ million)
Exhibit 206: Other Southeast Asian Countries Data Center Physical Security Market Overview ($ million)
Exhibit 207: Other Southeast Asian Countries Data Center Physical Security Market by Investment 2022–2028 ($ million)
Exhibit 208: Other Southeast Asian Countries Data Center Physical Security Market by Product 2022–2028 ($ million)

LIST OF TABLES

Table 1: Global Risk Index (2022)
Table 2: North America Data Center Physical Security Market by Country-wise Investment ($ million)
Table 3: North America Data Center Physical Security Market by Product Investment ($ million)
Table 4: Latin America Data Center Physical Security Market by Country-wise Investment ($ million)
Table 5: Latin America Data Center Physical Security Market by Product Investment ($ million)
Table 6: Western Europe Data Center Physical Security Market by Country-wise Investment ($ million)
Table 7: Western Europe Data Center Physical Security Market by Product Investment ($ million)
Table 8: Nordics Data Center Physical Security Market by Country-wise Investment ($ million)
Table 9: Nordics Data Center Physical Security Market by Product Investment ($ million)
Table 10: Central & Eastern Europe Data Center Physical Security Market by Country-wise Investment ($ million)
Table 11: Central & Eastern Europe Data Center Physical Security Market by Product Investment ($ million)
Table 12: Middle East Data Center Physical Security Market by Country-wise Investment ($ million)
Table 13: Middle East Data Center Physical Security Market by Product Investment ($ million)
Table 14: Africa Data Center Physical Security Market by Country-wise Investment ($ million)
Table 15: Africa Data Center Physical Security Market by Product Investment ($ million)
Table 16: APAC Data Center Physical Security Market by Country-wise Investment ($ million)
Table 17: APAC Data Center Physical Security Market by Product Investment ($ million)
Table 18: Southeast Asia Data Center Physical Security Market by Country-wise Investment ($ million)
Table 19: Southeast Asia Data Center Physical Security Market by Product Investment ($ million)
Table 20: Global Data Center Physical Security Market 2022–2028
Table 21: Global Data Center Physical Security Market by Product 2022–2028 ($ million)
Table 22: Global Data Center Physical Security Market by Physical Security Layer 2022–2028 ($ million)
Table 23: Global Data Center Physical Security Market by End-user 2022–2028 ($ million)
Table 24: Global Data Center Physical Security Market by Geography 2022–2028 ($ million)
Table 25: North America Data Center Physical Security Market by Product 2022–2028 ($ million)
Table 26: US Data Center Physical Security Market by Product 2022–2028 ($ million)
Table 27: Canada Data Center Physical Security Market by Product 2022–2028 ($ million)
Table 28: Latin America Data Center Physical Security Market by Product 2022–2028 ($ million)
Table 29: Brazil Data Center Physical Security Market by Product 2022–2028 ($ million)
Table 30: Mexico Data Center Physical Security Market by Product 2022–2028 ($ million)
Table 31: Chile Data Center Physical Security Market by Product 2022–2028 ($ million)
Table 32: Colombia Data Center Physical Security Market by Product 2022–2028 ($ million)
Table 33: Rest of Latin America Data Center Physical Security Market by Product 2022–2028 ($ million)
Table 34: Western Europe Data Center Physical Security Market by Product 2022–2028 ($ million)
Table 35: UK Data Center Physical Security Market by Product 2022–2028 ($ million)
Table 36: France Data Center Physical Security Market by Product 2022–2028 ($ million)
Table 37: Germany Data Center Physical Security Market by Product 2022–2028 ($ million)
Table 38: Netherlands Data Center Physical Security Market by Product 2022–2028 ($ million)
Table 39: Ireland Data Center Physical Security Market by Product 2022–2028 ($ million)
Table 40: Switzerland Data Center Physical Security Market by Product 2022–2028 ($ million)
Table 41: Italy Data Center Physical Security Market by Product 2022–2028 ($ million)
Table 42: Spain Data Center Physical Security Market by Product 2022–2028 ($ million)
Table 43: Belgium Data Center Physical Security Market by Product 2022–2028 ($ million)
Table 44: Other Western European Countries Data Center Physical Security Market by Product 2022–2028 ($ million)
Table 45: Nordics Data Center Physical Security Market by Product 2022–2028 ($ million)
Table 46: Denmark Data Center Physical Security Market by Product 2022–2028 ($ million)
Table 47: Sweden Data Center Physical Security Market by Product 2022–2028 ($ million)
Table 48: Norway Data Center Physical Security Market by Product 2022–2028 ($ million)
Table 49: Finland & Iceland Data Center Physical Security Market by Product 2022–2028 ($ million)
Table 50: Central & Eastern European Countries Data Center Physical Security Market by Product 2022–2028 ($ million)
Table 51: Russia Data Center Physical Security Market by Product 2022–2028 ($ million)
Table 52: Poland Data Center Physical Security Market by Product 2022–2028 ($ million)
Table 53: Austria Data Center Physical Security Market by Product 2022–2028 ($ million)
Table 54: Other Central & Eastern European Countries Data Center Physical Security Market by Product 2022–2028 ($ million)
Table 55: Middle East Data Center Physical Security Market by Product 2022–2028 ($ million)
Table 56: UAE Data Center Physical Security Market by Product 2022–2028 ($ million)
Table 57: Saudi Arabia Data Center Physical Security Market by Product 2022–2028 ($ million)
Table 58: Israel Data Center Physical Security Market by Product 2022–2028 ($ million)
Table 59: Other Middle Eastern Countries Data Center Physical Security Market by Product 2022–2028 ($ million)
Table 60: Africa Data Center Physical Security Market by Product 2022–2028 ($ million)
Table 61: South Africa Data Center Physical Security Market by Product 2022–2028 ($ million)
Table 62: Kenya Data Center Physical Security Market by Product 2022–2028 ($ million)
Table 63: Nigeria Data Center Physical Security Market by Product 2022–2028 ($ million)
Table 64: Other African Countries Data Center Physical Security Market by Product 2022–2028 ($ million)
Table 65: APAC Data Center Physical Security Market by Product 2022–2028 ($ million)
Table 66: China Data Center Physical Security Market by Product 2022–2028 ($ million)
Table 67: Hong Kong Data Center Physical Security Market by Product 2022–2028 ($ million)
Table 68: Australia Data Center Physical Security Market by Product 2022–2028 ($ million)
Table 69: New Zealand Data Center Physical Security Market by Product 2022–2028 ($ million)
Table 70: India Data Center Physical Security Market by Product 2022–2028 ($ million)
Table 71: Japan Data Center Physical Security Market by Product 2022–2028 ($ million)
Table 72: South Korea Data Center Physical Security Market by Product 2022–2028 ($ million)
Table 73: Taiwan Data Center Physical Security Market by Product 2022–2028 ($ million)
Table 74: Rest of APAC Data Center Physical Security Market by Product 2022–2028 ($ million)
Table 75: Southeast Asia Data Center Physical Security Market by Product 2022–2028 ($ million)
Table 76: Singapore Data Center Physical Security Market by Product 2022–2028 ($ million)
Table 77: Indonesia Data Center Physical Security Market by Product 2022–2028 ($ million)
Table 78: Malaysia Data Center Physical Security Market by Product 2022–2028 ($ million)
Table 79: Thailand Data Center Physical Security Market by Product 2022–2028 ($ million)
Table 80: Philippines Data Center Physical Security Market by Product 2022–2028 ($ million)
Table 81: Vietnam Data Center Physical Security Market by Product 2022–2028 ($ million)
Table 82: Other Southeast Asian Countries Data Center Physical Security Market by Product 2022–2028 ($ million)

Select a license type that suits your business needs

single-user Single User Licence
$5500.00
  • Report accessible by one user only
  • Free 10% or 3 days of customization
  • Free post-sale service assistance
  • Continuous support through email
Best Value Tag
5-user 5 User Licence
$6000.00
  • Report accessible by 5 users within the organization
  • Free 15% or 4.5 days of customization
  • Free post-sale service assistance
  • Continuous support through email and telephone
  • Free analyst hour
  • Free Upgrade: If an updated report published within 180 days of purchase, you will get the revised report free of charge
corporate.png Corporate Licence
$7500.00
  • Free Datasheet worth $1500
  • Report accessible by the entire organization
  • Free 20% or 6 days of customization
  • Free post-sale service assistance
  • Continuous support through email and telephone
  • Direct access to lead analysts
  • Free analyst hour
  • Free Upgrade: If an updated report published within 180 days of purchase, you will get the revised report free of charge
datasheet.png Datasheet Licence
$2000.00
  • Report accessible by 1 user only
  • Free 15% or 32 hours of customization
  • Free post-sale service assistance
  • Direct access to lead analysts
Licence Types What are these?

Interested in data center portfolio for this report?
Click here

Our Clientele

data-center-client

Our Clients Speak

erick

"The report by Arizton was spot on. It not only gave us insight into the pro audio market, we used it to raise funds for our company. The data proved (to the VC we pitched to) that the market was large enough for our company to not only survive but also grow."

Erik Young
CEO, Co-founder
Audink Inc., DBA Audios
SPEAK WITH OUR ANALYST

Want to know more about the report or any specific requirement?

Click to Email +1-312-235-2040

No One Understands the Data Center Market Better than ARIZTON.

banner
10

CATEGORIES

GET SAMPLES BEFORE PURCHASE

500

REPORTS

GET SAMPLES BEFORE PURCHASE

banner
25

COUNTRIES

GET SAMPLES BEFORE PURCHASE

banner
50+

VENDORS

GET SAMPLES BEFORE PURCHASE

Explore Data Center Reports

What makes this report premium?

1.

The exclusive and most exhaustive research report

3.

Reflect the most authentic market sentiments

2.

Continous update with new content and analysis

4.

The reports are best value for money

banner

We Have the Most Exhaustive, Unique & Exclusive Reports for Data Center Market .

premium-man

Why Arizton?

  • 100% Customer Satisfaction
  • 24x7 availability – we are always there when you need us
  • 200+ Fortune 500 Companies trust Arizton's report
  • 80% of our reports are exclusive and first in the industry
  • 100% more data and analysis
  • 1000+ reports published till date