Europe Data Center Colocation Market – Industry Outlook & Forecast 2025-2030
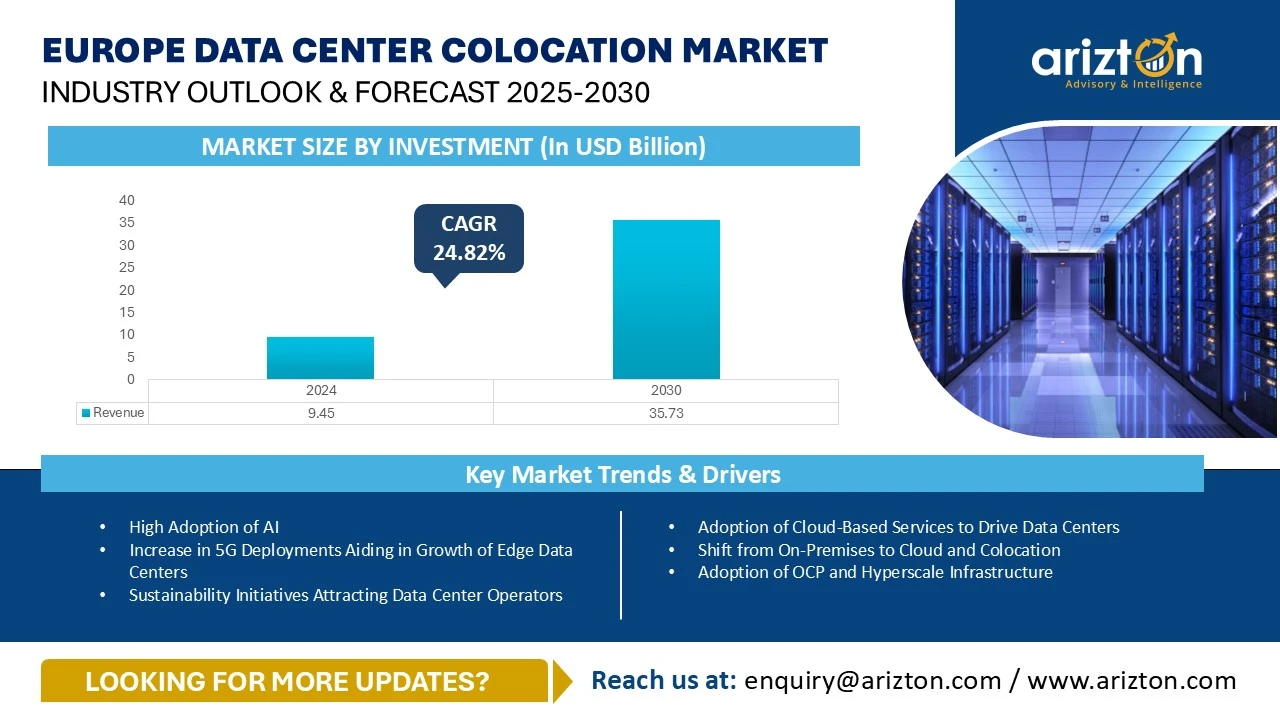
EUROPE DATA CENTER COLOCATION MARKET SIZE BY INVESTMENT WAS VALUED AT USD 9.45 BILLION IN 2024 AND IS EXPECTED TO REACH USD 35.73 BILLION BY 2030, GROWING AT A CAGR OF 24.82% DURING THE FORECAST PERIOD.

The Europe Data Center Colocation Market Report: Investment, Area, Power Capacity, and Share Analysis. Get Insights By Colocation Type, By Infrastructure, By Electrical Infrastructure, By Mechanical Infrastructure, By Cooling Systems, By Cooling Technique
Published Date : January 2026
Last Updated : May 2026
format: PDF
edition : Sixth Edition
460 pages
3 region
22 countries
159 company
9 segments
Purchase Options
Europe Data Center Colocation Market – Industry Outlook & Forecast 2025-2030
EUROPE DATA CENTER COLOCATION MARKET SIZE BY INVESTMENT WAS VALUED AT USD 9.45 BILLION IN 2024 AND IS EXPECTED TO REACH USD 35.73 BILLION BY 2030, GROWING AT A CAGR OF 24.82% DURING THE FORECAST PERIOD.
The Europe Data Center Colocation Market Report Includes
- Colocation Type: Retail Colocation and Wholesale Colocation
- Infrastructure: Electrical Infrastructure, Mechanical Infrastructure, and General Construction
- Electrical Infrastructure: UPS Systems, Generators, Transfer Switches & Switchgear, PDUs, and Other Electrical Infrastructure
- Mechanical Infrastructure: Cooling Systems, Racks, and Other Mechanical Infrastructure
- Cooling Systems: CRAC & CRAH Units, Chiller Units, Cooling Towers, Condensers & Dry Coolers, and Other Cooling Units
- Cooling Techniques: Air-based Cooling and Liquid-based Cooling
- General Construction: Core & Shell Development, Installation & Commissioning Services, Engineering & Building Design, Fire Detection & Suppression, Physical Security, and DCIM/BMS Solutions
- Tier Standard: Tier I & II, Tier III, and Tier IV
- Geography: Western Europe, Nordic, and Central & Eastern European Countries
Get Insights on 1414 Existing Data Center Facilities and 308 Upcoming Facilities across Europe
This report includes market data points, ranging from trend
analyses to market estimates & forecasts that you can customize
EUROPE DATA CENTER COLOCATION MARKET REPORT SCOPE
| REPORT ATTRIBUTE | DETAILS |
|---|---|
| MARKET SIZE BY INVESTMENT 2030 | USD 35.73 Billion |
| MARKET SIZE BY INVESTMENT 2024 | USD 9.45 Billion |
| CAGR - INVESTMENT (2024-2030) | 24.82% |
| MARKET SIZE - COLOCATION REVENUE (2030) | USD 37 Billion |
| MARKET SIZE AREA (2030) | 14.79 million sq. feet |
| POWER CAPACITY (2030) | 3,391.4 MW (2030) |
| BASE YEAR | 2024 |
| FORECAST YEAR | 2025-2030 |
| MARKET SEGMENTS | Colocation Service, Infrastructure, Electrical Infrastructure, Mechanical Infrastructure, Cooling Systems, Cooling Techniques, General Construction, Tier Standards, and Geography |
| GEOGRAPHICAL ANALYSIS | Western Europe, Nordic, and Central & Eastern European Countries |
EUROPE DATA CENTER COLOCATION MARKET SIZE
The Europe data center colocation market size by investment was valued at USD 9.45 billion and is expected to reach USD 35.73 billion by 2030, growing at a CAGR of 24.82% during the forecast period. The market is experiencing significant growth, driven by several growth factors, such as, increasing adoption of artificial intelligence, rapid digitalization, increasing adoption of sustainability practices among data center operators, government support for data center industries, surge in cloud adoption, rising submarine and inland connectivity, increasing adoption of big data, machine learning and Internet of Things, enterprise shift from on-premises to cloud platforms, increasing investments in 5G connectivity deployment, rise in district heating concept, innovative construction technologies adoption by data center operators and other factors. The rapid surge in adoption of Artificial Intelligence has become one of the most vital factors driving data center investments across the European countries, and most of these countries like the UK, Spain, Italy, Greece, Norway, Denmark, Austria, and others have also established specific national artificial inteligence strategies to promote the development of ethical artificial intelligence framework and to promote enterprises across multiple sectors to leverage artificial intelligence for their daily operations to boost efficiency and productivity.
The continuous rise in the adoption of cloud computing and artificial intelligence technologies among enterprises across various sectors is expected to rapidly increase the demand for wholesale colocation services in the upcoming years across European countries. Although the retail colocation segment is also slated to experience substantial demand, as several public and private companies are still prioritizing hosting their critical data and workloads in third-party data centers due to the sensitive nature of data and data sovereignty.
EUROPE DATA CENTER COLOCATION MARKET KEY HIGHLIGHTS
The Europe data center colocation market is expected to witness cumulative investments of approximately $144.03 billion, of which, the Western Europe is slated to account for around $101.51 billion, representing around 70.48% of the overall investment share in the European region, followed by Nordics that contributed for approximately 20.60% of Europe data center colocation investments, and Central and Eastern European region contributed for around 8.92% of the investments in the region.
As the adoption of artificial intelligence is increasing significantly, European countries are slated to experience the development of advanced AI-ready data centers featuring clusters of advanced GPUs, high-density racks delivering rack power densities of over 50 kW, advanced liquid cooling technologies, and higher IT load capacities to support artificial intelligence workloads processing and high-performance computing efficiently in the forthcoming years.
Colocation operators will require huge amounts of electricity to process artificial intelligence and high-performance computing workloads. Therefore, the colocation service providers across European countries are slated to invest in developing advanced data centers that can deliver higher IT capacities in the upcoming years. This trend is expected to significantly increase the demand for industrial electricity across European countries, and we believe it will lead to an increase in the costs of industrial electricity significantly over the next five years across European countries.
In European countries, enterprises across a wide range of sectors, including finance, manufacturing, retail, healthcare, government, and others, are preferring to transfer their less critical data and workloads to the cloud platforms. We expect the cloud companies will seek to lease wholesale colocation space to host large data from multiple users in the European region in the upcoming years, which is slated to create several growth opportunities for wholesale colocation companies operating across the European nations over the next three to five years.
The factors like supply chain disruptions, lack of skilled workforce, water scarcity challenges, poor grid infrastructure across the rural areas and power scarcity in major European hubs are hampering the growth and development of the Europe data center colocation market. The governments across the member states of the European Union are addressing these challenges by upskilling current labour with advanced technologies, attracting foreign workforce, encouraging domestic manufacturing of critical data center components, investing in enhancing grid infrastructure across the European countries and introducing water-efficient technologies to support data center growth across the European countries.
EUROPE DATA CENTER COLOCATION MARKET MARKET OPPORTUNITIES & TRENDS
High Adoption of Artificial Intelligence
- The enterprises across a wide range of industries, including BFSI, healthcare, retail, transport, manufacturing, e-commerce, government, and other industries across European countries, are significantly adopting artificial intelligence to boost their productivity and operational efficiency. The reliance on artificial intelligence applications is witnessing a rapid surge across the region. Therefore, the local and global colocation companies, such as Equinix, Telehouse, Digital Realty, Vantage Data Centers, Bulk Infrastructure, STACK Infrastructure, and others, are investing significantly to expand artificial infrastructure across European countries.
- In February 2025, Data4, a European data center services provider, collaborated with Brookfield Infrastructure Partners to boost artificial intelligence infrastructure across France with an investment of around $20.7 billion over the next five years.
- The surge in adoption of artificial intelligence across various industries is leading to an increase in the demand for advanced digital infrastructure in European countries, which is expected to increase investments for the construction of AI-ready data centers across European countries to store and process the massive volumes of data that artificial intelligence applications generate. For instance, in January 2025, iGenius, an Italian AI company, collaborated with NVIDIA for the development of AI AI-ready data center in Southern Italy with an investment of around $102 million.
- The adoption of artificial intelligence is expected to witness a further surge in European countries in the upcoming years. This trend will increase demand for AI-ready data centers. The demand for high rack-power density and liquid cooling technologies will also increase significantly to support artificial intelligence workloads across European countries in the upcoming years.
Increase in 5G Deployments Aiding in Growth of Edge Data Centers
- The telecommunications service providers across the European countries are investing significantly to expand their 5G network connectivity to enable individuals across the European countries with high-connectivity and ultra-low latency networking services. For instance, in March 2025, Sunrise, a Swiss mobile operator, announced its plans to develop a 5G standalone network in Switzerland to enable individuals and enterprises with low-latency networking services.
- The 5G networks deliver ultra-low latency and high bandwidth connectivity, which requires the data to be stored and processed closer to the end-users. Edge data centers are gaining traction to minimise latency by processing data closer to the source, which minimizes the time it takes for data to travel from centralized data centers.
- With the surge in 5G network connectivity deployment, the requirement for local data processing and storage will also increase, boosting the investments for the development of edge data center facilities across multiple locations in Europe. Therefore, the European nations are slated to witness the development of multiple edge data centers across multiple locations in the forecast period. For example, in September 2025, a German construction company, Hochtief, launched a new edge data center, spanning around 96.8 thousand square feet in Düsseldorf, Germany.
Sustainability Initiatives Attracting Data Center Operators
- Data centers consume a significant share of electricity, and these facilities have a substantial impact on the environment. The data center facilities across the European countries are significantly adopting sustainability practices as the demand for environmentally friendly digital infrastructure is gaining importance in the region. To support the European nations’ climate-neutrality targets, data center operators are under pressure to minimize their carbon emissions, improve energy efficiency, enhance waste management, and integrate renewable energy to power their data center operations. Therefore, the colocation firms are incorporating efficient and advanced cooling systems, water-saving technologies, and renewable sources to power their data centers.
- In May 2025, Digital Realty collaborated with a renewable energy company, Ridge Energy, to source approximately 5.1 MW of solar capacity to power Digital Realty’s data centers
- In April 2025, Verne announced that the company would replace the diesel generators in its London data center with Hydrogenated Vegetable oil-powered generators to mitigate approximately 90% of carbon emissions.
- The adoption of sustainability practices in the data center industry attracts both local and international colocation firms to invest in the development of eco-friendly data centers across European countries. Colocation companies in European countries will continue to focus on developing and operating data center facilities with green standards, as they reduce operating costs and meet environmental regulations.
Rise in District Heating Concept
- District heating is emerging as one of the significant sustainable practices among European data centers, as this process can enhance reutilization of waste heat by collecting the waste heat generated by IT equipment in data centers, and source it to nearby district heating systems for the purpose of addressing local heat requirements.
- According to the Heat Roadmap Study in Europe, the expansion of district heating systems across European countries can address around 50% of the heat demand in the region by 2050. As of 2025, the European countries consist of approximately 17 thousand district heating systems.
- In April 2025, atNorth, a European data center firm, collaborated with Kesko Corporation, a Finnish retail company, to supply waste heat from atNorth’s FIN02 data center in Espoo to a Kesko store to minimize the carbon emissions of the data center by 200 tons annually.
- The district heating systems in European countries are vital to achieve sustainability and carbon-neutral objectives. The data center operators should integrate renewable energy sources and reduce carbon emissions to adopt efficient methods of heat distribution. The district heating systems are expected to serve as a key solution to enhance energy efficiency and promote local economic development in the European region.
EUROPE DATA CENTER COLOCATION MARKET SEGMENTATION INSIGHTS
- In the European region, the colocation operators are significantly focusing on adopting innovative construction technologies, such as, installing advanced cooling technologies in data centers to manage excess heat loads generated in data center facilities, replacing diesel generators with hydrogenated vegetable oil powered generators, replacing traditional lead-acid batteries with lithium-ion batteries, designing data centers to leverage renewable energy for their operations to minimize electricity consumption, installing solar panels on data center roofs to power data centers with solar energy, designing data centers to leverage natural air to dissipate excess amounts of heat generated by advanced servers, incorporating advanced softwares like Building Management System (BMS), and Data Center Infrastructure Management (DCIM) to minimize the colocation companies’ operational costs and energy consumption, while focusing on boosting data center performance.
- The colocation firms across the European region are investing to adopt modular and containerised data center modules as these designs are expected to yield long-term cost savings, while reducing data center construction timelines.
- Several data center operators are prioritizing to development of renewable energy power plants like solar power plants, and wind energy power plants at their data center facilities to reduce reliance on national grids to procure power for data center operations. Developing on-site power stations and substations at data center facilities can enhance a continuous power supply for uninterrupted data center operations.
- The adoption of Hydrogenated Vegetable Oil as an alternative to diesel in data center generators is anticipated to increase significantly in the forecast period as the colocation firms are increasingly focusing on adopting sustainability practices to mitigate their carbon footprints. For example, in April 2025, Verne planned to replace diesel generators in its London data center with hydrotreated vegetable oil powered generators to reduce over 90% of carbon emissions in partnership with Crown Oil.
- Real-time monitoring software, featuring artificial intelligence and automation, is becoming increasingly important in data centers across the European region as data center operators are seeking smarter infrastructure to manage rising energy costs, ensure strict regulatory compliance, improve uptime, and efficiently handle high-performance workloads in data centers.
- The companies are increasingly prioritizing investing in installing advanced liquid cooling technologies, such as direct-to-chip liquid cooling technology and immersion cooling technology in data centers as these technologies are becoming vital to dissipate an excessive amount of heat generated by IT equipment in data centers to process artificial intelligence workloads. The investments in the installation of advanced coolant distribution units, rear-door heat exchangers, immersion cooling tanks and other liquid cooling infrastructure are increasing significantly for efficient thermal management in data centers.
- The demand for high-density racks is increasing rapidly across European data centers, as European governments are making substantial efforts to enhance artificial intelligence frameworks across European countries. Traditional racks are insufficient to manage artificial intelligence workloads. Therefore, the colocation firms across the European countries are increasingly adopting high-density racks that can offer rack power densities of more than 50 kWh per rack to process artificial intelligence workloads efficiently.
- Data center operators are increasingly collaborating with major technology giants to procure Graphics Processing Units (GPUs) as the traditional Central Processing Units cannot efficiently handle artificial intelligence workloads. The demand for advanced Graphics Processing Units is slated to increase significantly among the European data centers in the upcoming years, thereby creating growth opportunities for the companies that manufacture and supply advanced Graphics Processing Units for data centers.
- The colocation firms are increasingly focusing on enhancing the physical security of their data centers by installing advanced fire suppression systems and multiple layers of physical security systems. As the data centers host crucial and sensitive data, they are frequently targeted by sabotage attempts and physical intrusions. The colocation operators across European countries are investing in installing intelligent security systems such as high-definition cameras, dual authentication access control systems, and perimeter fencing in data centers. Additionally, the companies are also investing in special fire suppression agents and very early smoke detection apparatus systems to protect data centers against potential physical and fire threats.
EUROPE DATA CENTER COLOCATION MARKET GEOGRAPHICAL ANALYSIS
As of June 2025, the European region housed approximately 1,414 operational colocation data center facilities, operated by more than 493 data center operators. Western Europe accounted for around 1,006 operational colocation data center facilities as of June 2025, and around 125 data centers were located in the Nordic region in the same period. Meanwhile, the Central & Eastern European region housed approximately 283 operational data center facilities as of June 2025. In 2025, the European region is witnessing the development of around 361 data center facilities, of which around 255 data centers are either in construction or in planned phase in the Western Europe, around 71 facilities are being developed or have been planned to be developed in the Nordic region, and approximately 35 data center facilities are being developed or have been planned to be developed in the Central & Eastern European region.
FLAP-D markets are well-established and developed data center markets in the European region. The FLAP-D markets have contributed to a combined power capacity share of approximately 53.78% in the Europe data center colocation market in 2024. However, the data center development in the FLAP-D markets has slowed down in recent years owing to the power availability constraints and stricter regulations. Therefore, the secondary European markets, including Italy, Spain, Norway, Sweden, Poland, and others, are slated to witness a rapid surge in data center development in the upcoming years because of the power availability and lower electricity costs across these countries. Oslo, Madrid, Milan, Helsinki, Lisbon, and others are some of the fastest emerging locations for data center development in the European region.
Data center construction costs differ widely across European countries, with Switzerland ranking among the most expensive markets with data center construction costs of approximately $14.24 per watt as of 2025. The costs of data center construction in Norway and Sweden are around $12.41 per watt. Meanwhile, in Denmark, it is approximately $12.29 per watt. In European nations like the UK, the data center construction cost is approximately $12.02 per watt as of 2025. These high costs are due to factors like lack of power availability, expensive labour, rapidly increasing demand for data centers and other factors.
The Free Trade Zones, Special Economic Zones, and Industrial Parks in European countries provide a wide range of benefits to the data center operators to establish and operate their data centers within these zones. The members of the European Union consist of approximately 62 operational Free Trade Zones as of 2025 that support enterprises across a wide range of industries, including data centers, by providing several benefits, such as essential infrastructure support, tax incentives, VAT exemptions, 100% foreign ownership, shared resource facility, and other benefits.
The costs of industrial electricity in European countries vary from one country to another, and the overall electricity costs in the European region are moderate to high. For example, the cost of industrial electricity in the UK ranges between $0.3 to $0.4 per kWh, in Germany, it is approximately $0.18 per kWh, and in Italy, the cost of industrial electricity is around $0.24 per kWh. The cost of industrial electricity in FLAP-D markets is comparatively higher than in other locations of the European region due to the scarcity of electricity across these locations and a rapid surge in data center development.
EUROPE DATA CENTER COLOCATION MARKET VENDOR LANDSCAPE
- The Europe data center colocation market consists of several prominent colocation operators such as Ark Data Centres, AtlasEdge, atNorth, and Beyond.pl, Bulk Infrastructure, CloudHQ, Colt Data Centre Services, CyrusOne, Data4, Digital Realty, EdgeConneX, Equinix, Global Switch, Green Mountain, Serverfarm, Iron Mountain, K2 STRATEGIC, Kao Data, Keppel Data Centres, LCL Data Centers, maincubes SECURE DATACENTERS, MERLIN Properties, Nation Data Center, NTT DATA, Penta Infra, Polar, Pure Data Centres Group, QTS Data Centers, STACK Infrastructure, STORESPEED, Vantage Data Centers, VIRTUS Data Centres, Yondr Group, and others.
- Europe is also experiencing the entry of several new entrants that are expanding their footprints into the European countries to develop and operate their data centers for addressing the growing demands for colocation services across the European countries. Some of the new entrants in Europe data center colocation market include Ada Infrastructure, Apto, Art Data Centres, Blue Star, Corscale Data Centers, DAMAC Digital, DATA CASTLE, Deep Green, Digital Reef, EdgeMode, EdgeNebula, evroc, Form8tion Data Centers, Goodman, GreenScale Data Centres, Kevlinx Data Centers, Compass Datacenters, Latos Data Centres, Mainova WebHouse, Nostrum Group, Prime Data Centers, Prologis, Quetta Data Centers, SDC Capital Partners, SEGRO plc, Servecentric, Templus, Valore Group, VITALI SPA, X5 Group, XTX Markets, Yandex, Wilton International, and others.
- In the European region, Digital Realty, Equinix, NTT DATA, Global Switch, CyrusOne, Ark Data Centres, and other colocation companies were the major contributors that accounted for generate significant share of colocation revenue in the Europe data center colocation market in 2024.
SNAPSHOT
The Europe data center colocation market by investment is projected to reach USD 35.73 billion by 2030, growing at a CAGR of 24.82% from 2024 to 2030.
The following factors are likely to contribute to the growth of the Europe data center colocation market during the forecast period:
- Adoption of Cloud-Based Services to Drive Data Centers
- Shift from On-Premises to Cloud and Colocation
- Adoption of OCP and Hyperscale Infrastructure
- Government Support for Data Center Development
Base Year: 2024
Forecast Year: 2025-2030
The report considers the present scenario of the Europe data center colocation market and its market dynamics for 2025−2030. It covers a detailed overview of several market growth enablers, restraints, and trends. The study includes the demand and supply aspects of the Europe data center colocation industry.
Key Data Center Colocation Operators
- 3data Premium Data Centers
- Business Overview
- Product Offerings
- Play Business Solutions
- Aire Networks
- AQ Compute
- Ark Data Centres
- Artnet
- Aruba SpA
- Atlantic Data Infrastructure
- AtlasEdge
- Atman
- atNorth
- Atomdata
- Bahnhof
- Beyond.pl
- Blue
- Bulk Infrastructure
- China Mobile International
- CloudHQ
- Colt Data Centre Services
- CyrusOne
- Data4
- DataCenter United
- Datum Datacentres
- DENV-R
- Digital Realty
- EcoDataCenter
- EdgeConneX
- Equinix
- Global Switch
- Global Technical Realty
- Green
- Green Mountain
- Serverfarm
- Iron Mountain
- IXcellerate
- K2 STRATEGIC
- Kao Data
- Keppel Data Centres
- LCL Data Centers
- Linxdatacenter
- maincubes SECURE DATACENTERS
- MERLIN Properties
- MTS
- Nation Data Center
- Nehos
- Nscale
- NTT DATA
- OpCore
- Penta Infra
- PHOCEA DC
- Polar
- Pure Data Centres Group
- QTS Data Centers
- Rostelecom
- Selectel
- STACK Infrastructure
- STACKIT
- STORESPEED
- Switch
- Telehouse
- Thésée DataCenter
- Vantage Data Centers
- VIRTUS Data Centres
- Yondr Group
New Entrants
- ECO-LocaXion
- Business Overview
- Product Offerings
- 1911 Data Centers
- ACS Group
- Ada Infrastructure
- SWI Group
- Apatura
- Apto
- Arcem
- Aroundtown SA
- Art Data Centres
- Asia Pacific Land (APL)
- AVAIO Digital Partners
- Blue Star
- Box2Bit
- Brookfield
- Caineal LLP
- Corscale Data Centers
- DAMAC Digital
- DATA CASTLE
- Data Center Partners
- DayOne
- Northtree Investment Management
- DATA for MED
- dataR GmbH
- DC01UK
- Deep Green
- Digital Reef
- Digital Land & Development
- EdgeMode
- EdgeNebula
- Edora
- EID LLP
- Elementica
- Elite UK REIT
- Energia Group
- EngineNode
- G42
- evroc
- BADEN CLOUD
- FCDC Corp
- Form8tion Data Centers
- Goodman
- GreenScale Data Centres
- GREYKITE
- ICADE
- iGenius
- Kevlinx Data Centers
- Compass Datacenters
- Keysource and Namsos DataSenter
- Kennedy Wilson
- Latos Data Centres
- Liberum Navitas
- Lidl
- Link Park Heathrow
- Mainova WebHouse
- Mistral AI
- Edged
- Greystoke
- NETHITS IT SOLUTIONS
- Norwich Research Park
- Nostrum Group
- Origin Energy Services & Woodland Investment Management
- Panattoni
- PATRIZIA SE
- PGIM Real Estate
- Polarnode
- Portland Trust
- Prime Data Centers
- Prologis
- Quetta Data Centers
- Red Admiral DC
- Regant
- Salt Ayre Leisure Centre
- Sarenet
- SDC Capital Partners
- SEGRO plc
- Servecentric
- Sesterce
- Solaria Energía y Medio Ambiente
- Stoneshield Capital
- Suomen Energiainsinöörit Oy
- Skygard
- Templus
- Thylander
- Tritax Group
- Valencia Digital Port Connect
- Valore Group
- VDR & Colliers
- VITALI SPA
- WS Computing AS
- X5 Group
- XTX Markets
- Yandex
- Wilton International
- CompassForge Ventures
Segmentation by Colocation Type
- Retail Colocation
- Wholesale Colocation
Segmentation by Infrastructure
- Electrical Infrastructure
- Mechanical Infrastructure
- General Construction
Segmentation by Electrical Infrastructure
- UPS Systems
- Generators
- Transfer Switches & Switchgear
- PDUs
- Other Electrical Infrastructure
Segmentation by Mechanical Infrastructure
- Cooling Systems
- Racks
- Other Mechanical Infrastructure
Segmentation by Cooling Systems
- CRAC & CRAH Units
- Chiller Units
- Cooling Towers, Condensers & Dry Coolers
- Other Cooling Units
Segmentation by Cooling Techniques
- Air-based Cooling
- Liquid-based Cooling
Segmentation by General Construction
- Core & Shell Development
- Installation & Commissioning Services
- Engineering & Building Design
- Fire Detection & Suppression
- Physical Security
- DCIM/BMS Solutions
Segmentation by Tier Standard
- Tier I & II
- Tier III
- Tier IV
Segmentation by Geography
- Western Europe
- UK
- Germany
- France
- Netherlands
- Ireland
- Switzerland
- Italy
- Spain
- Portugal
- Belgium
- Greece
- Luxembourg
- Nordic
- Denmark
- Sweden
- Norway
- Finland
- Iceland
- Central & Eastern Europe
- Russia
- Poland
- Austria
- Czechia
- Other Central & Eastern European Countries
EUROPE DATA CENTER COLOCATION MARKET FAQs
How big is the Europe data center colocation market?
What is the growth rate of the Europe data center colocation market?
What are the key trends in the Europe data center colocation market?
How many MW of power capacity is expected to reach the Europe data center colocation market by 2030?
What is the estimated market size in terms of area in the Europe data center colocation market by 2030?
For more details, please reach us at [email protected]
1. ABOUT ARIZTON
2. ABOUT OUR DATA CENTER CAPABILITIES
3. WHAT’S INCLUDED
4. SEGMENTS INCLUDED
5. RESEARCH METHODOLOGY
6. MARKET AT GLANCE
7. PREMIUM INSIGHTS
8. INTRODUCTION
9. EUROPE DATA CENTER COLOCATION MARKET LANDSCAPE
10. NORDICS DATA CENTER COLOCATION MARKET LANDSCAPE
11. CENTRAL & EASTERN EUROPE DATA CENTER COLOCATION MARKET LANDSCAPE
12. EUROPE DATA CENTER COLOCATION MARKET VENDOR ANALYSIS
13. EUROPE DATA CENTER COLOCATION MARKET OVERVIEW
14. DATA CENTER FINANCING
15. GREEN DATA CENTER FINANCING
16. IMPACT OF TARIFF ON EUROPE DATA CENTER MARKET
17. INVESTMENT OPPORTUNITIES
17.1. INVESTMENT: MARKET SIZE & FORECAST
17.2. EU STRATEGIES
17.3. AREA: MARKET SIZE & FORECAST
17.4. POWER CAPACITY: MARKET SIZE & FORECAST
17.5. COLOCATION REVENUE: MARKET SIZE & FORECAST
18. MARKET DYNAMICS
18.1. MARKET OPPORTUNITIES & TRENDS
18.2. MARKET GROWTH ENABLERS
18.3. MARKET RESTRAINTS
18.4. SITE SELECTION CRITERIA
19. INFRASTRUCTURE SEGMENTATION
19.1. MARKET SEGMENTATION
19.2. COLOCATION SERVICE
19.3. ELECTRICAL INFRASTRUCTURE
19.4. MECHANICAL INFRASTRUCTURE
19.5. COOLING SYSTEMS
19.6. COOLING TECHNIQUES
19.7. GENERAL CONSTRUCTION
20. TIER STANDARDS SEGMENTATION
21. GEOGRAPHY SEGMENTATION
22. MARKET BY GEOGRAPHY
23. WESTERN EUROPE
23.1. MARKET BY INVESTMENT
23.2. MARKET BY AREA
23.3. MARKET BY POWER CAPACITY
23.4. COLOCATION REVENUE
23.5. RETAIL VS WHOLESALE COLOCATION PRICING
23.6. KEY SUPPORT INFRASTRUCTURE ADOPTION
24. UK
24.1. MARKET BY INVESTMENT
24.2. MARKET BY AREA
24.3. MARKET BY POWER CAPACITY
24.4. COLOCATION REVENUE
24.5. RETAIL VS WHOLESALE COLOCATION PRICING
24.6. KEY SUPPORT INFRASTRUCTURE ADOPTION
24.7. LIST OF UPCOMING DATA CENTER PROJECTS IN THE UK
25. GERMANY
25.1. MARKET BY INVESTMENT
25.2. MARKET BY AREA
25.3. MARKET BY POWER CAPACITY
25.4. COLOCATION REVENUE
25.5. RETAIL VS WHOLESALE COLOCATION PRICING
25.6. KEY SUPPORT INFRASTRUCTURE ADOPTION
25.7. LIST OF UPCOMING DATA CENTER PROJECTS IN GERMANY
26. FRANCE
26.1. MARKET BY INVESTMENT
26.2. MARKET BY AREA
26.3. MARKET BY POWER CAPACITY
26.4. COLOCATION REVENUE
26.5. RETAIL VS WHOLESALE COLOCATION PRICING
26.6. KEY SUPPORT INFRASTRUCTURE ADOPTION
26.7. LIST OF UPCOMING DATA CENTER PROJECTS IN FRANCE
27. NETHERLANDS
27.1. MARKET BY INVESTMENT
27.2. MARKET BY AREA
27.3. MARKET BY POWER CAPACITY
27.4. COLOCATION REVENUE
27.5. RETAIL VS WHOLESALE COLOCATION PRICING
27.6. KEY SUPPORT INFRASTRUCTURE ADOPTION
27.7. LIST OF UPCOMING DATA CENTER PROJECTS IN NETHERLANDS
28. IRELAND
28.1. MARKET BY INVESTMENT
28.2. MARKET BY AREA
28.3. MARKET BY POWER CAPACITY
28.4. COLOCATION REVENUE
28.5. RETAIL VS WHOLESALE COLOCATION PRICING
28.6. KEY SUPPORT INFRASTRUCTURE ADOPTION
28.7. LIST OF UPCOMING DATA CENTER PROJECTS IN IRELAND
29. ITALY
29.1. MARKET BY INVESTMENT
29.2. MARKET BY AREA
29.3. MARKET BY POWER CAPACITY
29.4. COLOCATION REVENUE
29.5. RETAIL VS WHOLESALE COLOCATION PRICING
29.6. KEY SUPPORT INFRASTRUCTURE ADOPTION
29.7. LIST OF UPCOMING DATA CENTER PROJECTS IN ITALY
30. SPAIN
30.1. MARKET BY INVESTMENT
30.2. MARKET BY AREA
30.3. MARKET BY POWER CAPACITY
30.4. COLOCATION REVENUE
30.5. RETAIL VS WHOLESALE COLOCATION PRICING
30.6. KEY SUPPORT INFRASTRUCTURE ADOPTION
30.7. LIST OF UPCOMING DATA CENTER PROJECTS IN SPAIN
31. SWITZERLAND
31.1. MARKET BY INVESTMENT
31.2. MARKET BY AREA
31.3. MARKET BY POWER CAPACITY
31.4. COLOCATION REVENUE
31.5. RETAIL VS WHOLESALE COLOCATION PRICING
31.6. KEY SUPPORT INFRASTRUCTURE ADOPTION
31.7. LIST OF UPCOMING DATA CENTER PROJECTS IN SWITZERLAND
32. BELGIUM
32.1. MARKET BY INVESTMENT
32.2. MARKET BY AREA
32.3. MARKET BY POWER CAPACITY
32.4. COLOCATION REVENUE
32.5. RETAIL VS WHOLESALE COLOCATION PRICING
32.6. KEY SUPPORT INFRASTRUCTURE ADOPTION
32.7. LIST OF UPCOMING DATA CENTER PROJECTS IN BELGIUM
33. PORTUGAL
33.1. MARKET BY INVESTMENT
33.2. MARKET BY AREA
33.3. MARKET BY POWER CAPACITY
33.4. COLOCATION REVENUE
33.5. RETAIL VS WHOLESALE COLOCATION PRICING
33.6. KEY SUPPORT INFRASTRUCTURE ADOPTION
33.7. LIST OF UPCOMING DATA CENTER PROJECTS IN PORTUGAL
34. GREECE
34.1. MARKET BY INVESTMENT
34.2. MARKET BY AREA
34.3. MARKET BY POWER CAPACITY
34.4. COLOCATION REVENUE
34.5. RETAIL VS WHOLESALE COLOCATION PRICING
34.6. KEY SUPPORT INFRASTRUCTURE ADOPTION
34.7. LIST OF UPCOMING DATA CENTER PROJECTS IN GREECE
35. LUXEMBOURG
35.1. MARKET BY INVESTMENT
35.2. MARKET BY AREA
35.3. MARKET BY POWER CAPACITY
35.4. COLOCATION REVENUE
35.5. KEY SUPPORT INFRASTRUCTURE ADOPTION
36. NORDICS
36.1. MARKET BY INVESTMENT
36.2. MARKET BY AREA
36.3. MARKET BY POWER CAPACITY
36.4. COLOCATION REVENUE
36.5. RETAIL VS WHOLESALE COLOCATION PRICING
36.6. KEY SUPPORT INFRASTRUCTURE ADOPTION
37. DENMARK
37.1. MARKET BY INVESTMENT
37.2. MARKET BY AREA
37.3. MARKET BY POWER CAPACITY
37.4. COLOCATION REVENUE
37.5. RETAIL VS WHOLESALE COLOCATION PRICING
37.6. KEY SUPPORT INFRASTRUCTURE ADOPTION
37.7. LIST OF UPCOMING DATA CENTER PROJECTS IN DENMARK
38. SWEDEN
38.1. MARKET BY INVESTMENT
38.2. MARKET BY AREA
38.3. MARKET BY POWER CAPACITY
38.4. COLOCATION REVENUE
38.5. RETAIL VS WHOLESALE COLOCATION PRICING
38.6. KEY SUPPORT INFRASTRUCTURE ADOPTION
38.7. LIST OF UPCOMING DATA CENTER PROJECTS IN SWEDEN
39. NORWAY
39.1. MARKET BY INVESTMENT
39.2. MARKET BY AREA
39.3. MARKET BY POWER CAPACITY
39.4. COLOCATION REVENUE
39.5. RETAIL VS WHOLESALE COLOCATION PRICING
39.6. KEY SUPPORT INFRASTRUCTURE ADOPTION
39.7. LIST OF UPCOMING DATA CENTER PROJECTS IN NORWAY
40. FINLAND
40.1. MARKET BY INVESTMENT
40.2. MARKET BY AREA
40.3. MARKET BY POWER CAPACITY
40.4. COLOCATION REVENUE
40.5. RETAIL VS WHOLESALE COLOCATION PRICING
40.6. KEY SUPPORT INFRASTRUCTURE ADOPTION
40.7. LIST OF UPCOMING DATA CENTER PROJECTS IN FINLAND
41. ICELAND
41.1. MARKET BY INVESTMENT
41.2. MARKET BY AREA
41.3. MARKET BY POWER CAPACITY
41.4. COLOCATION REVENUE
41.5. RETAIL VS WHOLESALE COLOCATION PRICING
41.6. KEY SUPPORT INFRASTRUCTURE ADOPTION
41.7. LIST OF UPCOMING DATA CENTER PROJECTS IN ICELAND
42. CENTRAL & EASTERN EUROPE
42.1. MARKET BY INVESTMENT
42.2. MARKET BY AREA
42.3. MARKET BY POWER CAPACITY
42.4. COLOCATION REVENUE
42.5. RETAIL VS WHOLESALE COLOCATION PRICING
42.6. KEY SUPPORT INFRASTRUCTURE ADOPTION
43. RUSSIA
43.1. MARKET BY INVESTMENT
43.2. MARKET BY AREA
43.3. MARKET BY POWER CAPACITY
43.4. COLOCATION REVENUE
43.5. RETAIL VS WHOLESALE COLOCATION PRICING
43.6. KEY SUPPORT INFRASTRUCTURE ADOPTION
43.7. LIST OF UPCOMING DATA CENTER PROJECTS IN RUSSIA
44. POLAND
44.1. MARKET BY INVESTMENT
44.2. MARKET BY AREA
44.3. MARKET BY POWER CAPACITY
44.4. COLOCATION REVENUE
44.5. RETAIL VS WHOLESALE COLOCATION PRICING
44.6. KEY SUPPORT INFRASTRUCTURE ADOPTION
44.7. LIST OF UPCOMING DATA CENTER PROJECTS IN POLAND
45. AUSTRIA
45.1. MARKET BY INVESTMENT
45.2. MARKET BY AREA
45.3. MARKET BY POWER CAPACITY
45.4. COLOCATION REVENUE
45.5. RETAIL VS WHOLESALE COLOCATION PRICING
45.6. KEY SUPPORT INFRASTRUCTURE ADOPTION
45.7. LIST OF UPCOMING DATA CENTER PROJECTS IN AUSTRIA
46. CZECHIA
46.1. MARKET BY INVESTMENT
46.2. MARKET BY AREA
46.3. MARKET BY POWER CAPACITY
46.4. COLOCATION REVENUE
46.5. RETAIL VS WHOLESALE COLOCATION PRICING
46.6. KEY SUPPORT INFRASTRUCTURE ADOPTION
46.7. LIST OF UPCOMING DATA CENTER PROJECTS IN CZECHIA
47. OTHER CENTRAL & EASTERN EUROPEAN COUNTRIES
47.1. MARKET BY INVESTMENT
47.2. MARKET BY AREA
47.3. MARKET BY POWER CAPACITY
47.4. COLOCATION REVENUE
47.5. RETAIL VS WHOLESALE COLOCATION PRICING
47.6. KEY SUPPORT INFRASTRUCTURE ADOPTION
47.7. LIST OF UPCOMING DATA CENTER PROJECTS IN OTHER CENTRAL & EASTERN EUROPEAN COUNTRIES
48. COMPETITIVE LANDSCAPE
48.1. MARKET SHARE BY COLOCATION POWER CAPACITY
48.2. MARKET SHARE BY COLOCATION REVENUE
49. MARKET PARTICIPANTS
49.1. COLOCATION INVESTORS
49.2. NEW ENTRANTS
50. QUANTITATIVE SUMMARY
51. APPENDIX
51.1. ABBREVIATIONS
51.2. DEFINITIONS
51.3. SEGMENTAL COVERAGE
Select a license type that suits your business needs
Single User Licence
- Report accessible by one user only
- Free 10% or 3 days of customization
- Free post-sale service assistance
- Continuous support through email
5 User Licence
- Report accessible by 5 users within the organization
- Free 15% or 4.5 days of customization
- Continuous support through email and telephone
- Free analyst hour
- Free Upgrade: If an updated report published within 180 days of purchase, you will get the revised report free of charge
Corporate Licence
- Free Datasheet worth $1500
- Report accessible by the entire organization
- Free 20% or 6 days of customization
- Free post-sale service assistance
- Continuous support through email and telephone
- Direct access to lead analysts
- Free analyst hour
- Free Upgrade: If an updated report published within 180 days of purchase, you will get the revised report free of charge
Datasheet Licence
- Report accessible by 1 user only
- Free 15% or 32 hours of customization
- Free post-sale service assistance
- Direct access to lead analysts
Frequently Asked Questions
How big is the Europe data center colocation market?
What is the growth rate of the Europe data center colocation market?
What are the key trends in the Europe data center colocation market?
How many MW of power capacity is expected to reach the Europe data center colocation market by 2030?
What is the estimated market size in terms of area in the Europe data center colocation market by 2030?
Other RELATED Reports

Switzerland Data Center Colocation Market – Supply & Demand Analysis 2025-2030
Published : November 2025
Germany Data Center Colocation Market – Supply & Demand Analysis 2025-2030
Published : November 2025
Ireland Data Center Colocation Market – Supply & Demand Analysis 2025-2030
Published : November 2025