Global Hyperscale Data Center Market Landscape 2025-2030
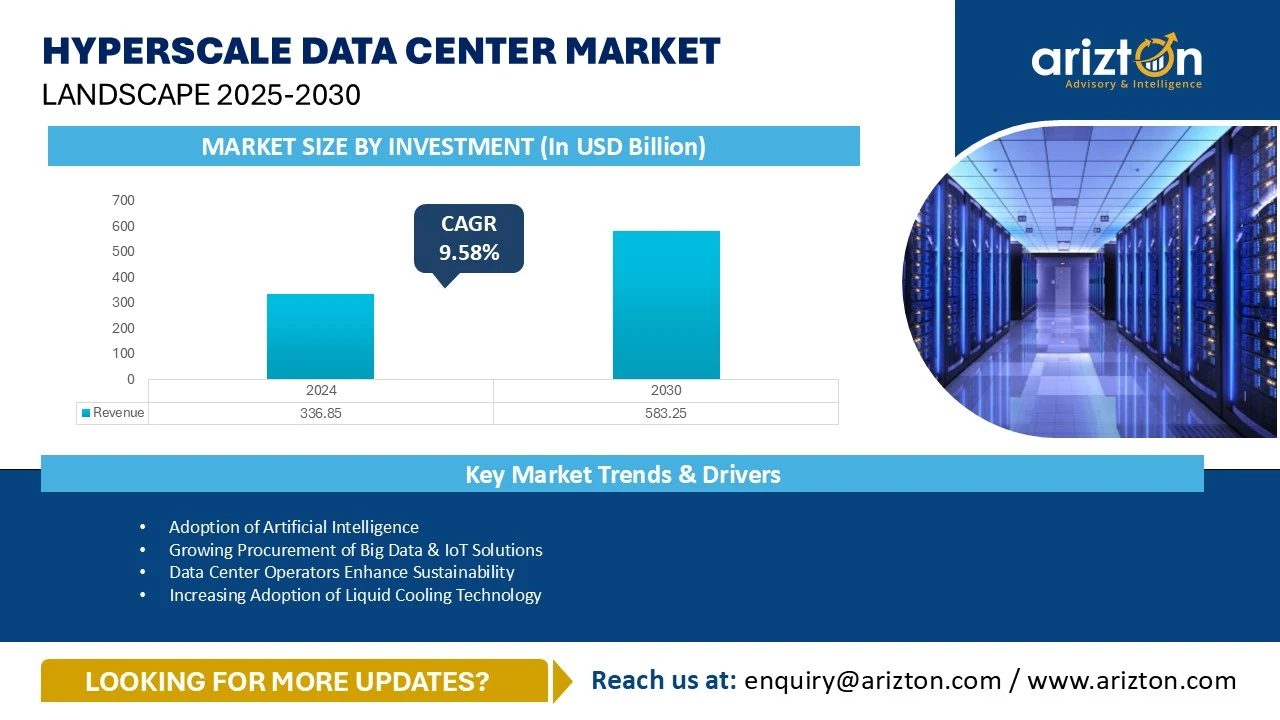
GLOBAL HYPERSCALE DATA CENTER MARKET SIZE WITNESSED INVESTMENTS OF USD 336.85 BILLION IN 2024 AND WILL WITNESS INVESTMENTS OF USD 583.25 BILLION BY 2030, GROWING AT A CAGR OF 9.58% DURING THE FORECAST PERIOD.

Hyperscale Data Center Market Size, Share, Trends Analysis By Infrastructure, IT Infrastructure, Mechanical Infrastructure, Electrical Infrastructure, Cooling Systems, Cooling Technique, General Construction, Tier Standards, & Geography
Published Date : October 2025
Last Updated : October 2025
format: PDF
edition : Second Edition
545 pages
231 company
9 segments
9 region
38 countries
Purchase Options
Global Hyperscale Data Center Market Landscape 2025-2030
GLOBAL HYPERSCALE DATA CENTER MARKET SIZE WITNESSED INVESTMENTS OF USD 336.85 BILLION IN 2024 AND WILL WITNESS INVESTMENTS OF USD 583.25 BILLION BY 2030, GROWING AT A CAGR OF 9.58% DURING THE FORECAST PERIOD.
The Hyperscale Data Center Market Size, Share, & Trends Analysis By
- Infrastructure: IT Infrastructure, Electrical Infrastructure, Mechanical Infrastructure, and General Construction
- IT Infrastructure: Server Infrastructure, Storage Infrastructure, and Network Infrastructure
- Electrical Infrastructure: UPS Systems, Generators, Transfer Switches & Switchgear, PDUs, and Other Electrical Infrastructure
- Mechanical Infrastructure: Cooling Systems, Racks, and Other Mechanical Infrastructure
- Cooling System: CRAC & CRAH Units, Chiller Units, Cooling Towers, Condensers & Dry Coolers, Economizers & Evaporative Coolers, and Other Cooling Units
- Cooling Technique: Air-based and Liquid-based
- General Construction: Core & Shell Development, Installation & Commissioning Services, Engineering & Building Design, Fire Detection & Suppression, Physical Security, and DCIM/BMS Solutions
- Tier Standards: Tier I & Tier II, Tier III, and Tier IV
- Geography: North America, Latin America, Western Europe, Nordics, Central & Eastern Europe, Middle East, Africa, APAC, and Southeast Asia
Industry Analysis Report, Regional Outlook, Growth Potential, Price Trends, Competitive Market Share & Forecast 2025–2030.
This report includes market data points, ranging from trend
analyses to market estimates & forecasts that you can customize
GLOBAL HYPERSCALE DATA CENTER MARKET REPORT SCOPE
| REPORT ATTRIBUTE | DETAILS |
|---|---|
| MARKET SIZE – INVESTMENT (2030) | USD 583.25 Billion |
| MARKET SIZE – INVESTMENT (2024) | USD 336.85 Billion |
| CAGR - INVESTMENT (2023-2029) | 9.58% |
| MARKET SIZE: AREA (2030) | 72 million sq. Feet |
| MARKET SIZE: POWER CAPACITY (2030) | 17,152 MW (2030) |
| HISTORIC YEAR | 2021-2023 |
| BASE YEAR | 2024 |
| FORECAST YEAR | 2025-2030 |
| SEGMENTS BY | Infrastructure, IT Infrastructure, Electrical Infrastructure, Mechanical Infrastructure, Cooling Systems, Cooling Technique, General Construction, Tier Standards, and Geography |
| GEOGRAPHIC ANALYSIS | North America, Latin America, Western Europe, Nordics, Central & Eastern Europe, the Middle East, Africa, APAC, and Southeast Asia |
HYPERSCALE DATA CENTER MARKET SIZE
The global hyperscale data center market size witnessed investments of USD 336.85 billion in 2024 and will witness investments of USD 583.25 billion by 2030, growing at a CAGR of 9.58% during the forecast period. The global hyperscale data center market is experiencing rapid growth, with many large hyperscale facilities being built. This expansion is likely to result in higher energy consumption and carbon emissions. To mitigate this impact, many data center companies are investing in clean, renewable energy to power both their existing and upcoming facilities, helping to minimize their environmental footprint. Furthermore, the global hyperscale data center market is driven by an increase in the deployment of AI workloads across data centers worldwide, triggered by billions of dollars in annual investments from hyperscale operators, including AWS, Apple, Google, Meta (formerly Facebook), Alibaba, Tencent, and Microsoft.
HYPERSCALE DATA CENTER MARKET TRENDS
Adoption of Artificial Intelligence
- Adoption of AI across various industries for enhanced operations has witnessed significant improvement, and it has also increased demand for computing power and advanced data management.
- In May 2024, Microsoft announced that it had signed an MoU with the government to provide an AI-powered future. It also announced that it has constructed a new cloud and AI infrastructure in Thailand.
Growing Procurement of Big Data & IoT Solutions
- The IoT, which connects the digital and physical worlds using a network of sensors, contributes to the fast development of data traffic. Implementing 5G networks for mobile devices will aid the significant growth of IoT and Big data analytics during the forecast period.
- The rapid adoption of IoT across industries, supported by government initiatives and major tech firms, continues to drive efficiency, sustainability, and innovation worldwide. As 5G and AI integration expand, IoT applications will continue to transform sectors like energy, manufacturing, and smart infrastructure.
Increase in Rack Power Density
- The Uptime Institute’s 2024 survey reveals that the average rack density is around 8 kW, driven by high-power server processors and GPU deployments, and some facilities have even deployed rack densities of over 50 kW to 100 kW to support enterprise, colocation, and cloud segments.
- AI, big data, IoT, and cloud computing increase rack densities by requiring more powerful servers and storage systems. These systems pack higher processing and storage capabilities into compact spaces to handle intensive workloads efficiently.
Deployment of Microgrids in Data Centers
- A microgrid is a localized energy grid that can function independently from the traditional power grid. It connects multiple power sources and data centers, collaborating with the primary grid to support various functions.
- In Europe, the growing trend of using microgrids to power data centers, such as the Google data center in Eemshaven, Netherlands, enhances energy independence, resilience, and sustainability.
Increasing Adoption of Liquid Cooling Technology
- The rising use of the internet, digital technologies, AI, and the Internet of Things (IoT) is driving the need for data centers and higher rack power density. As the demand for advanced technology increases, the load on data centers will also increase. With more IT power, the heat generated in these data centers rises. To address this issue, many data centers are turning to liquid-cooling systems as they are more efficient than traditional air-cooling methods. This trend is expected to continue, with the demand for liquid-based cooling systems increasing in the coming years.
- In December 2024, AWS introduced hybrid cooling systems combining air and direct-to-chip liquid cooling to efficiently manage the high power and thermal demands of AI workloads in all its data center facilities, supporting advanced processors like Trainium2 and Nvidia GB200 NVL72.
Data Center Operators Enhance Sustainability
- The rising demand for data centers is leading to an increase in power. To meet this demand, data center operators and the government are adopting green energy. Over the next few years, the demand for green energy is expected to grow, with the government taking steps to ensure its use in data centers across the globe.
- Data center operators are adopting renewable energy in their facilities across the globe. Many data center operators are signing PPA for their facility. For instance, Google signed three major PPAs in India to achieve a carbon-free energy grid. The first PPA was signed with Adani Energy, derived from the Khavda solar-wind hybrid project in Gujarat, offering 30 GW of total capacity for three PPAs, and it is set to be completed by 2026. The second PPA is with CleanMax, with 125.4 MW and 66 MW of solar in Rajasthan and 59.4 MW of onshore wind energy in Karnataka.
Rising Demand for Cloud-based Services
- The adoption of cloud computing services and applications continues to rise rapidly, leading to the establishment of vast hyperscale cloud-based data centers. Cloud computing changes the dynamics of data center facilities, leading to several innovations and the inculcation of modern infrastructure.
- The adoption of cloud-based services is a significant driver for the growth and transformation of data centers. As organizations continue to migrate their operations to the cloud, they get access to several benefits, including enhanced scalability, improved operational efficiency, and access to advanced technologies.
US TARIFF IMPACT ON GLOBAL HYPERSCAL DATA CENTER MARKET
- A trade war refers to an economic conflict in which countries impose tariffs or other trade barriers against each other, typically as a response to similar actions taken by the opposing party. Currently, the world is witnessing the emergence of a global trade war, sparked by the US’s imposition of tariffs on a growing list of countries.
- On April 2, 2025, the US President Donald Trump introduced new tariffs, referred to as reciprocal tariffs, on imports from approximately. 90 countries. Described by the president as “Liberation Day,” the move aims to address the US's trade deficit with countries from China to the EU. The tariffs, which include an across-the-board 10% tax on all imports, mark a significant escalation in the ongoing trade tensions between the US and other countries.
- However, on April 9, 2025, President Trump backtracked on parts of his tariff plan, announcing a 90-day pause on the reciprocal tariffs. Therefore, the general tariff rate was reduced to 10% for most countries. The significant exception remains China, as on April 16, 2025, China faced 245% tariffs on most of its exports to the US, based on the most recent revisions in Trump’s trade policies. China responded with 125% tariffs on US products.
- The recent tariff war has posed a challenge for data center infrastructure, particularly in sourcing raw materials, as increased import and export taxes are expected to raise overall infrastructure costs. For example, the United States has imposed tariffs of around 245% on China, which will increase the cost of equipment imported from China and nearby regions. In response, China has imposed tariffs of around 125% on the United States, which will raise the cost of materials such as electronic equipment that China imports from the U.S.
- The recent increase in tariffs has started to threaten both the rising cost and lead time of data center construction. Some of the construction-related materials that may be impacted include iron and steel, aluminum, and other materials that are crucial to data center development.
HYPERSCALE DATA CENTER MARKET SEGMENTATION INSIGHTS
- The global hyperscale data center market continues to witness significant growth in terms of IT infrastructure investment, with an absolute growth rate of around 190% between 2021 and 2024. In addition, the market is expected to witness significant growth in terms of IT infrastructure, with an absolute growth rate of around 44% between 2025 and 2030.
- The use of advanced technologies, such as cloud, IoT, big data, quantum computing, and AI, by businesses is expected to increase the adoption of HPC infrastructure in the coming years across the globe.
- The global hyperscale data center market continues to witness the adoption of liquid cooling in data centers, which is continuously increasing and is expected to witness an absolute growth rate of 142% between 2025 and 2030.
- Hyperscale operators such as AWS, Google, Meta, and Microsoft are actively developing their data center projects across the globe. These operators focus more on the deployment of OCP-scale infrastructure in their data center facilities. This drives the investments for OCP infrastructure across the globe. For instance, in May 2025, Google announced that it had joined Meta and Microsoft in the "Mount Diablo" project. This project aims to develop a new power rack system that can support data center racks with power density up to 1MW at OCP MEA.
GEOGRAPHICAL ANALYSIS
- In the global hyperscale data center market, the US and China are continuously dominating the market in terms of investment and power capacity. However, there are many countries across the globe witnessing exponential growth due to AI, including countries across APAC, Europe, Latin America, and MEA regions. For instance, the US and China contribute to around 70% of the hyperscale data center investments in 2024.
- In the Global hyperscale data center market, North America dominates in terms of investment and power capacity. This is driven by the increasing demand for AI and the expansion of cloud services across North America, along with favorable regulatory, government support, and power support. However, some areas of North America face some power constraints.
- In North America, the US has contributed the highest market share in terms of investments & power capacity in 2024, followed by Canada.
- APAC is one of the fastest-growing data center markets in terms of investment and power capacity after North America. Over the past two or three years, the region has witnessed an explosion in the demand for digitalization, AI, and cloud computing. The government has taken the initiative to develop proper infrastructure for the data center, which has helped attract global as well as local data center investors to the APAC region. However, some countries within APAC, such as Hong Kong & Singapore, face land and power constraints as well as regulatory & permitting delays.
- In APAC, China dominates the data center market in terms of investment, followed by Malaysia, Australia, Japan, India, Singapore, South Korea, Indonesia, Thailand, Hong Kong, New Zealand, the Philippines, Taiwan, and Vietnam.
- The Malaysian data center market is growing due to the spillover demand from Singapore, and we expect that Malaysia will surpass Singapore's capacity in the next three to four years, owing to the significant rise in investments.
- Europe ranks third in the global hyperscale data center market in terms of investment and power capacity after North America & APAC region. The European region has its own data privacy law and regulatory system, which helps to drive investment in data centers across the European region. Additionally, Europe has strong infrastructure connectivity through land and sea. However, the region also faces some challenges, such as high land and power costs.
- The Middle East & Africa is one of the fastest-growing hyperscale data center markets, ranking fourth globally in terms of investment and power capacity. The MEA region offers ample land, abundant solar and wind renewable energy resources, and government support through Various initiatives and programs.
- South Africa leads in investment in the MEA region, followed by Saudi Arabia, the UAE, Israel, and Kenya.
- Latin America ranks fifth in the global hyperscale data center market in terms of investment and power capacity. Brazil leads in terms of investment, followed by Mexico and Chile.
HYPERSCALE DATA CENTER MARKET VENDOR LANDSCAPE
- The global hyperscale data center market has the presence of IT infrastructure providers such as Arista Networks, Atos, Broadcom, Cisco Systems, DataDirect Networks (DDN), Dell Technologies, Extreme Networks, Fujitsu, Hewlett Packard Enterprise, itachi Vantara, Huawei Technologies, IBM, Infortrend Technology, Inspur, Intel, Lenovo, NetApp, Nimbus Data, NVIDIA, Toshiba, Wiwynn, and others that provide advanced IT infrastructure across the globe.
- Key players in the support infrastructure for the data centers market include 3M, ABB, Airedale, Alfa Laval, Asetek Carrier, Caterpillar, Condair Group, Cummins, Cyber Power Systems, Dakin Applied, Eaton, Generac Power Systems, Green Revolution Cooling, Honeywell, Johnson Controls, Legrand, Rehlko, Rittal, and others.
- The market has a presence of global contractors and subcontractors, such as AECOM, Arup, AtkinsRéalis, Aurecon Group, Basler & Hofmann, Benthem Crouwel Architects, Bouygues Construction, CAP INGELEC, Collen Construction, Corgan, COWI, DPR Construction, DSCO Group, Edarat Group, EMCOR Group, Gensler, HDR Architecture, Turner & Townsend, Sterling and Wilson, and others.
- The increase in hyperscale data center construction is aiding in millions of dollars in revenues from the sector to the major civil contractors and subcontractors in the global hyperscale data center market.
- The market has witnessed new hyperscale data center operators such as 247 Data Centers, Ada Infrastructure, Anan, Apto Data Centre, Beacon AI Centers, Bluestar Data Centre, BW Digital, Colovore, DATA CASTLE, CloudBurst Data Centers, Desert Dragon Data Centers, Digital Reef, Elementica Epoch Digital Evroc, Gatineau Data Hub (GDH), Layer 9 Data Centers, Surfix Data Center, and others.
- Hyperscale operators like Meta (Facebook), Google, Microsoft, AWS, Alibaba, Tencent, and Apple are the major contributors to the global hyperscale data center market in terms of investment & power capacity.
SNAPSHOT
The global hyperscale data center market size is expected to grow at a CAGR of approximately 8.53% from 2024 to 2030.
The following factors are likely to contribute to the growth of the global hyperscale data center market during the forecast period:
- Enhanced Connectivity Through Submarine Cables
- Data Center Investments Backed by Governments
- Renewable Energy Initiatives by Hyperscale & Cloud Operators
Base Year: 2024
Forecast Year: 2025-2030
The report considers the present scenario of the global hyperscale data center market and its market dynamics for 2025−2030. It covers a detailed overview of several market growth enablers, restraints, and trends. The study covers both the demand and supply sides of the market. It also profiles and analyzes leading companies and several other prominent companies operating in the market.
The report includes the investment in the following areas:
Segmentation by Infrastructure
- IT Infrastructure
- Electrical Infrastructure
- Mechanical Infrastructure
- General Construction
Segmentation by IT Infrastructure
- Server Infrastructure
- Storage Infrastructure
- Network Infrastructure
Segmentation by Electrical Infrastructure
- UPS Systems
- Generators
- Transfer Switches & Switchgear
- PDUs
- Other Electrical Infrastructure
Segmentation by Mechanical Infrastructure
- Cooling Systems
- Racks
- Other Mechanical Infrastructure
Segmentation by Cooling System
- CRAC & CRAH Units
- Chiller Units
- Cooling Towers, Condensers & Dry Coolers
- Economizers & Evaporative Coolers
- Other Cooling Units
Segmentation by Cooling Technique
- Air-based
- Liquid-based
Segmentation by General Construction
- Core & Shell Development
- Installation & Commissioning Services
- Engineering & Building Design
- Fire Detection & Suppression
- Physical Security
- DCIM/BMS Solutions
Segmentation by Tier Standards
- Tier I & Tier II
- Tier III
- Tier IV
Segmentation by Geography
- North America
- The U.S.
- Canada
- Latin America
- Brazil
- Mexico
- Chile
- Other Latin American Countries
- Western Europe
- The U.K.
- Germany
- France
- Netherlands
- Ireland
- Italy
- Spain
- Other Western European Countries
- Nordics
- Denmark
- Sweden
- Norway
- Finland & Iceland
- Central & Eastern Europe
- Poland
- Austria
- Other Central & Eastern European Countries
- Middle East
- UAE
- Saudi Arabia
- Israel
- Other Middle East Countries
- Africa
- South Africa
- Kenya
- Other African Countries
- APAC
- China
- Hong Kong
- Australia
- New Zealand
- Japan
- India
- South Korea
- Taiwan
- Southeast Asia
- Singapore
- Indonesia
- Malaysia
- Thailand
- Philippines
- Vietnam
VENDORS LANDSCAPE
IT Infrastructure Provider
- Arista Networks
- Atos
- Broadcom
- Cisco Systems
- DataDirect Networks (DDN)
- Dell Technologies
- Extreme Networks
- Fujitsu
- Hewlett Packard Enterprise
- Hitachi Vantara
- Huawei Technologies
- IBM
- Infortrend Technology
- Inspur
- Intel
- Inventec Data Center Solutions
- Lenovo
- Micron Technology
- MiTAC Holdings
- NEC Corporation
- NetApp
- Nimbus Data
- NVIDIA
- Oracle
- Pure Storage
- QNAP Systems
- Quanta Cloud Technology
- Quantum
- Seagate Technology
- Silk
- Synology
- Toshiba
- Western Digital
- Wiwynn
Data Center Support Infrastructure Providers
- 3M
- ABB
- Airedale
- Alfa Laval
- Asetek
- Asperitas
- Assa Abloy
- Bloom Energy
- Carrier
- Caterpillar
- Condair Group
- CoolIT Systems
- Cormant
- Cummins
- Cyber Power Systems
- Daikin Applied
- DCX LIQUID COOLING SYSTEMS
- Delta Electronics
- Eaton
- Enlogic
- FNT Software
- Generac Power Systems
- GIGABYTE
- Green Revolution Cooling
- HITEC Power Protection
- Honeywell
- Iceotope
- Johnson Controls
- KyotoCooling
- Legrand
- LiquidStack
- Mitsubishi Electric
- Munters
- Natron Energy
- NetZoom
- Nlyte Software
- Panduit
- Pillar Power Systems
- Rehlko
- Rittal
- Rolls-Royce
- Schneider Electric
- Siemens
- STULZ
- Submer
- Trane
- Vertiv
- Yanmar
- ZincFive
Data Center Construction Contractors
- AECOM
- Arup
- AtkinsRéalis
- Aurecon Group
- Basler & Hofmann
- Benthem Crouwel Architects
- Bouygues Construction
- CAP INGELEC
- Collen Construction
- Corgan
- COWI
- DAR
- Deerns
- Dornan
- DPR Construction
- DSCO Group
- Edarat Group
- EMCOR Group
- Ethos Engineering
- EYP Mission Critical Facilities
- Flour Corporation
- Fortis Construction
- Gensler
- Gilbane Building Company
- HDR Architecture
- HITT Contracting
- Hoffmann Construction
- Holder Construction
- ISG
- Jacobs
- Kirby Group Engineering
- Laing O’Rourke
- Larsen & Toubro
- Linesight
- M+W Group (Exyte)
- Mace
- Mercury
- Mortenson
- NTT Facilities
- Quark Unlimited Engineering
- RED Engineering Design
- Haskoning
- Skanska
- STO Building Group
- Syska Hennessy Group
- Sterling and Wilson
- Turner Construction Company
- Structure Tone
- Turner & Townsend
- Winthrop Technologies
Data Center Investors
- AdaniConneX
- Africa Data Centres
- AirTrunk
- Aligned Data Centers
- Apple
- AtNorth
- AWS
- Big Data Exchange (BDx)
- CDC Data Centres
- center3
- Chindata Group
- CloudHQ
- Cologix
- Compass Data Centers
- CoreSite
- CyrusOne
- Data4
- DataBank
- Digital Realty
- EdgeConneX
- Equinix
- Meta (Facebook)
- Flexential
- GDS Services
- Global Switch
- Green Mountain
- Gulf Data Hub
- Iron Mountain
- iXAfrica Data Centre
- Keppel Data Centres
- Khazna Data Centers
- Microsoft
- NEXTDC
- Novva Data Centers
- NTT DATA
- Nxtra by Airtel
- Rostelecom
- Scala Data Centers
- Sify Technologies
- ST Telemedia Global Data Centres
- SUNeVison Holdings
- T5 Data Centers
- Turkcell
- Vantage Data Centers
- Yondr
New Entrants
- 247 Data Centers
- Ada Infrastructure
- Anan
- Apto Data
- Ardent Data Centers
- Beacon AI Centers
- Bluestar Data Centre
- BW Digital
- CloudBurst Data Centers
- Colovore
- Crane Data Centers
- DATA CASTLE
- DataGrid
- DataVolt
- Desert Dragon Data Centers
- Digital Halo
- Digital Reef
- Doma Infrastructure Group
- Eclairion
- Edged Energy
- DAMAC Digital
- Elementica
- Energia Group
- Epoch Digital
- Evolution Data Centres
- Evroc
- Form8tion Data Centers
- Gatineau Data Hub (GDH)
- Gaw Capital
- GreenScale
- GreenSquareDC
- Kasi Cloud
- Latos
- Layer 9 Data Centers
- Mediterra Datacenters
- NE Edge
- PHOCEA DC
- PolarDC
- Prometheus Hyperscale
- Qareeb Data Centres
- Quantum Loophole
- Quetta Data Centers
- Rowan Digital Infrastructure
- Sahayeb Datacenters
- SC Zeus Data Centers
- SDC Capital Partners
- Serverz Data Center
- Surfix Data Center
- Techtonic
- Tract
- Trifalga
- YCO Cloud
GLOBAL HYPERSCALE DATA CENTER MARKET FAQs
How big is the global hyperscale data center market in terms of investments?
Which region holds the most significant global hyperscale data center market share?
What is the estimated market size in terms of area in the global hyperscale data center market by 2030?
How many MW of power capacity is expected to reach the global hyperscale data center market by 2030?
What is the growth rate of the global hyperscale data center market?
For more details, please reach us at [email protected]
1. ABOUT ARIZTON
2. ABOUT OUR DATA CENTER CAPABILITIES
3. WHAT’S INCLUDED
4. SEGMENTS INCLUDED
5. RESEARCH METHODOLOGY
6. MARKET AT GLANCE
7. PREMIUM INSIGHTS
8. IMPACT OF TARIFF ON GLOBAL HYPERSCAL DATA CENTER MARKET
9. INVESTMENT OPPORTUNITIES
9.1. INVESTMENT: MARKET SIZE & FORECAST
9.2. AREA: MARKET SIZE & FORECAST
9.3. POWER CAPACITY: MARKET SIZE & FORECAST
10. MARKET DYNAMICS
10.1. MARKET OPPORTUNITIES & TRENDS
10.2. MARKET GROWTH ENABLERS
10.3. MARKET RESTRAINTS
11. SITE SELECTION CRITERIA
12. INFRASTRUCTURE SEGMENTATION
12.1. IT INFRASTRUCTURE
12.2. ELECTRICAL INFRASTRUCTURE
12.3. MECHANICAL INFRASTRUCTURE
12.4. COOLING SYSTEMS
12.5. COOLING TECHNIQUES
12.6. GENERAL CONSTRUCTION
13. TIER STANDARDS SEGMENTATION
14. GEOGRAPHY SEGMENTATION
15. NORTH AMERICA
15.1. MARKET SNAPSHOT & KEY HIGHLIGHTS
15.2. DATA CENTER MARKET BY INVESTMENT
15.3. DATA CENTER MARKET BY INFRASTRUCTURE
15.4. DATA CENTER MARKET BY AREA
15.5. DATA CENTER MARKET BY POWER CAPACITY
15.6. DATA CENTER MARKET BY SUPPORT INFRASTRUCTURE
15.7. DATA CENTER MARKET BY IT INFRASTRUCTURE
16. US
16.1. INVESTMENT
16.2. MARKET BY INVESTMENT
16.3. AREA
16.4. MARKET BY AREA
16.5. POWER CAPACITY
16.6. MARKET BY POWER CAPACITY
16.7. KEY SUPPORT INFRASTRUCTURE ADOPTION
16.8. MARKET BY INFRASTRUCTURE
16.9. LIST OF UPCOMING DATA CENTER PROJECTS IN THE US
17. CANADA
17.1. INVESTMENT
17.2. MARKET BY INVESTMENT
17.3. AREA
17.4. MARKET BY AREA
17.5. POWER CAPACITY
17.6. MARKET BY POWER CAPACITY
17.7. KEY SUPPORT INFRASTRUCTURE ADOPTION
17.8. MARKET BY INFRASTRUCTURE
17.9. LIST OF UPCOMING DATA CENTER PROJECTS IN CANADA
18. LATIN AMERICA
18.1. MARKET SNAPSHOT & KEY HIGHLIGHTS
18.2. DATA CENTER MARKET BY INVESTMENT
18.3. DATA CENTER MARKET BY INFRASTRUCTURE
18.4. DATA CENTER MARKET BY AREA
18.5. DATA CENTER MARKET BY POWER CAPACITY
18.6. DATA CENTER MARKET BY SUPPORT INFRASTRUCTURE
18.7. DATA CENTER MARKET BY IT INFRASTRUCTURE
18.8. LIST OF UPCOMING DATA CENTER PROJECTS IN LATIN AMERICA
19. BRAZIL
19.1. INVESTMENT
19.2. MARKET BY INVESTMENT
19.3. AREA
19.4. MARKET BY AREA
19.5. POWER CAPACITY
19.6. MARKET BY POWER CAPACITY
19.7. KEY SUPPORT INFRASTRUCTURE ADOPTION
19.8. MARKET BY INFRASTRUCTURE
20. MEXICO
20.1. INVESTMENT
20.2. MARKET BY INVESTMENT
20.3. AREA
20.4. MARKET BY AREA
20.5. POWER CAPACITY
20.6. MARKET BY POWER CAPACITY
20.7. KEY SUPPORT INFRASTRUCTURE ADOPTION
20.8. MARKET BY INFRASTRUCTURE
21. CHILLE
21.1. INVESTMENT
21.2. MARKET BY INVESTMENT
21.3. AREA
21.4. MARKET BY AREA
21.5. POWER CAPACITY
21.6. MARKET BY POWER CAPACITY
21.7. KEY SUPPORT INFRASTRUCTURE ADOPTION
21.8. MARKET BY INFRASTRUCTURE
22. REST OF LATIN AMERICA
22.1. INVESTMENT
22.2. MARKET BY INVESTMENT
22.3. AREA
22.4. MARKET BY AREA
22.5. POWER CAPACITY
22.6. MARKET BY POWER CAPACITY
22.7. KEY SUPPORT INFRASTRUCTURE ADOPTION
22.8. MARKET BY IT INFRASTRUCTURE
23. WESTERN EUROPE
23.1. MARKET SNAPSHOT & KEY HIGHLIGHTS
23.2. DATA CENTER MARKET BY INVESTMENT
23.3. DATA CENTER MARKET BY INFRASTRUCTURE
23.4. DATA CENTER MARKET BY AREA
23.5. DATA CENTER MARKET BY POWER CAPACITY
23.6. DATA CENTER MARKET BY SUPPORT INFRASTRUCTURE
23.7. DATA CENTER MARKET BY IT INFRASTRUCTURE
23.8. LIST OF UPCOMING DATA CENTER PROJECTS IN WESTERN EUROPE
24. UK
24.1. INVESTMENT
24.2. MARKET BY INVESTMENT
24.3. AREA
24.4. MARKET BY AREA
24.5. POWER CAPACITY
24.6. MARKET BY POWER CAPACITY
24.7. KEY SUPPORT INFRASTRUCTURE ADOPTION
24.8. MARKET BY INFRASTRUCTURE
25. GERMANY
25.1. INVESTMENT
25.2. MARKET BY INVESTMENT
25.3. AREA
25.4. MARKET BY AREA
25.5. POWER CAPACITY
25.6. MARKET BY POWER CAPACITY
25.7. KEY SUPPORT INFRASTRUCTURE ADOPTION
25.8. MARKET BY INFRASTRUCTURE
26. FRANCE
26.1. INVESTMENT
26.2. MARKET BY INVESTMENT
26.3. AREA
26.4. MARKET BY AREA
26.5. POWER CAPACITY
26.6. MARKET BY POWER CAPACITY
26.7. KEY SUPPORT INFRASTRUCTURE ADOPTION
26.8. MARKET BY INFRASTRUCTURE
27. NETHERLANDS
27.1. INVESTMENT
27.2. MARKET BY INVESTMENT
27.3. AREA
27.4. MARKET BY AREA
27.5. POWER CAPACITY
27.6. MARKET BY POWER CAPACITY
27.7. KEY SUPPORT INFRASTRUCTURE ADOPTION
27.8. MARKET BY INFRASTRUCTURE
28. IRELAND
28.1. INVESTMENT
28.2. MARKET BY INVESTMENT
28.3. AREA
28.4. MARKET BY AREA
28.5. POWER CAPACITY
28.6. MARKET BY POWER CAPACITY
28.7. KEY SUPPORT INFRASTRUCTURE ADOPTION
28.8. MARKET BY INFRASTRUCTURE
29. ITALY
29.1. INVESTMENT
29.2. MARKET BY INVESTMENT
29.3. AREA
29.4. MARKET BY AREA
29.5. POWER CAPACITY
29.6. MARKET BY POWER CAPACITY
29.7. KEY SUPPORT INFRASTRUCTURE ADOPTION
29.8. MARKET BY INFRASTRUCTURE
30. SPAIN
30.1. MARKET OVERVIEW
31.2. MARKET BY INVESTMENT
31.3. AREA
31.4. MARKET BY AREA
31.5. POWER CAPACITY
31.6. MARKET BY POWER CAPACITY
31.7. KEY SUPPORT INFRASTRUCTURE ADOPTION
31.8. MARKET BY INFRASTRUCTURE
32. OTHER WESTERN EUROPEAN COUNTRIES
32.1. INVESTMENT
32.2. MARKET BY INVESTMENT
32.3. AREA
32.4. MARKET BY AREA
32.5. POWER CAPACITY
32.6. MARKET BY POWER CAPACITY
32.7. KEY SUPPORT INFRASTRUCTURE ADOPTION
32.8. MARKET BY INFRASTRUCTURE
33. NORDIC
33.1. MARKET SNAPSHOT & KEY HIGHLIGHTS
33.2. DATA CENTER MARKET BY INVESTMENT
33.3. DATA CENTER MARKET BY INFRASTRUCTURE
33.4. DATA CENTER MARKET BY AREA
33.5. DATA CENTER MARKET BY POWER CAPACITY
33.6. DATA CENTER MARKET BY SUPPORT INFRASTRUCTURE
33.7. DATA CENTER MARKET BY IT INFRASTRUCTURE
33.8. LIST OF UPCOMING DATA CENTER PROJECTS IN NORDIC
34. DENMARK
34.1. INVESTMENT
34.2. MARKET BY INVESTMENT
34.3. AREA
34.4. MARKET BY AREA
34.5. POWER CAPACITY
34.6. MARKET BY POWER CAPACITY
34.7. KEY SUPPORT INFRASTRUCTURE ADOPTION
34.8. MARKET BY INFRASTRUCTURE
35 SWEDEN
35.1. INVESTMENT
35.2. MARKET BY INVESTMENT
35.3. AREA
35.4. MARKET BY AREA
35.5. POWER CAPACITY
35.6. MARKET BY POWER CAPACITY
35.7. KEY SUPPORT INFRASTRUCTURE ADOPTION
35.8. MARKET BY INFRASTRUCTURE
36. NORWAY
36.1. INVESTMENT
36.2. MARKET BY INVESTMENT
36.3. AREA
36.4. MARKET BY AREA
36.5. POWER CAPACITY
36.6. MARKET BY POWER CAPACITY
36.7. KEY SUPPORT INFRASTRUCTURE ADOPTION
36.8. MARKET BY INFRASTRUCTURE
37. FINLAND & ICELAND
37.1. INVESTMENT
37.2. MARKET BY INVESTMENT
37.3. AREA
37.4. MARKET BY AREA
37.5. POWER CAPACITY
37.6. MARKET BY POWER CAPACITY
37.7. KEY SUPPORT INFRASTRUCTURE ADOPTION
37.8. MARKET BY INFRASTRUCTURE
38. CENTRAL & EASTERN EUROPEAN COUNTRIES
38.1. MARKET SNAPSHOT & KEY HIGHLIGHTS
38.2. DATA CENTER MARKET BY INVESTMENT
38.3. DATA CENTER MARKET BY INFRASTRUCTURE
38.4. DATA CENTER MARKET BY AREA
38.5. DATA CENTER MARKET BY POWER CAPACITY
38.6. DATA CENTER MARKET BY SUPPORT INFRASTRUCTURE
387. DATA CENTER MARKET BY IT INFRASTRUCTURE
38.8. LIST OF UPCOMING DATA CENTER PROJECTS IN CENTRAL & EASTERN EUROPEAN COUNTRIES
39. POLAND
39.1. INVESTMENT
39.2. MARKET BY INVESTMENT
39.3. AREA
39.4. MARKET BY AREA
39.5. POWER CAPACITY
39.6. MARKET BY POWER CAPACITY
39.7. KEY SUPPORT INFRASTRUCTURE ADOPTION
39.8. MARKET BY INFRASTRUCTURE
40. AUSTRIA
40.1. INVESTMENT
40.2. MARKET BY INVESTMENT
40.3. AREA
40.4. MARKET BY AREA
40.5. POWER CAPACITY
40.6. MARKET BY POWER CAPACITY
40.7. KEY SUPPORT INFRASTRUCTURE ADOPTION
40.8. MARKET BY INFRASTRUCTURE
41. OTHER CENTRAL & EASTERN EUROPEAN COUNTRIES
41.1. INVESTMENT
41.2. MARKET BY INVESTMENT
41.3. AREA
41.4. MARKET BY AREA
41.5. POWER CAPACITY
41.6. MARKET BY POWER CAPACITY
41.7. KEY SUPPORT INFRASTRUCTURE ADOPTION
41.8. MARKET BY INFRASTRUCTURE
42. MIDDLE EAST & AFRICA
42.1. MARKET SNAPSHOT & KEY HIGHLIGHTS
42.2. DATA CENTER MARKET BY INVESTMENT
42.3. DATA CENTER MARKET BY INFRASTRUCTURE
42.4. DATA CENTER MARKET BY AREA
42.5. DATA CENTER MARKET BY POWER CAPACITY
42.6. DATA CENTER MARKET BY SUPPORT INFRASTRUCTURE
42.7. DATA CENTER MARKET BY IT INFRASTRUCTURE
42.8. LIST OF UPCOMING DATA CENTER PROJECTS IN THE MIDDLE EAST
42.9. LIST OF UPCOMING DATA CENTER PROJECTS IN AFRICA
43. UAE
43.1. INVESTMENT
43.2. MARKET BY INVESTMENT
43.3. AREA
43.4. MARKET BY AREA
43.5. POWER CAPACITY
43.6. MARKET BY POWER CAPACITY
43.7. KEY SUPPORT INFRASTRUCTURE ADOPTION
43.8. MARKET BY INFRASTRUCTURE
44. SAUDI ARABIA
44.1. INVESTMENT
44.2. MARKET BY INVESTMENT
44.3. AREA
44.4. MARKET BY AREA
44.5. POWER CAPACITY
44.6. MARKET BY POWER CAPACITY
44.7. KEY SUPPORT INFRASTRUCTURE ADOPTION
44.8. MARKET BY INFRASTRUCTURE
45. ISRAEL
45.1. INVESTMENT
45.2. MARKET BY INVESTMENT
45.3. AREA
45.4. MARKET BY AREA
45.5. POWER CAPACITY
45.6. MARKET BY POWER CAPACITY
45.7. KEY SUPPORT INFRASTRUCTURE ADOPTION
45.8. MARKET BY INFRASTRUCTURE
46. OTHER MIDDLE EAST COUNTRIES
46.1. INVESTMENT
46.2. MARKET BY INVESTMENT
46.3. AREA
46.4. MARKET BY AREA
46.5. POWER CAPACITY
46.6. MARKET BY POWER CAPACITY
46.7. KEY SUPPORT INFRASTRUCTURE ADOPTION
46.8. MARKET BY INFRASTRUCTURE
47. SOUTH AFRICA
47.1. INVESTMENT
47.2. MARKET BY INVESTMENT
47.3. AREA
47.4. MARKET BY AREA
47.5. POWER CAPACITY
47.6. MARKET BY POWER CAPACITY
47.7. KEY SUPPORT INFRASTRUCTURE ADOPTION
47.8. MARKET BY INFRASTRUCTURE
48. KENYA
48.1. INVESTMENT
48.2. MARKET BY INVESTMENT
48.3. AREA
48.4. MARKET BY AREA
48.5. POWER CAPACITY
48.6. MARKET BY POWER CAPACITY
48.7. KEY SUPPORT INFRASTRUCTURE ADOPTION
48.8. MARKET BY INFRASTRUCTURE
49. OTHER AFRICAN COUNTRIES
49.1. INVESTMENT
49.2. MARKET BY INVESTMENT
49.3. AREA
49.4. MARKET BY AREA
49.5. POWER CAPACITY
49.6. MARKET BY POWER CAPACITY
49.7. KEY SUPPORT INFRASTRUCTURE ADOPTION
49.8. MARKET BY INFRASTRUCTURE
50. APAC
50.1. MARKET SNAPSHOT & KEY HIGHLIGHTS
50.2. DATA CENTER MARKET BY INVESTMENT
50.3. DATA CENTER MARKET BY INFRASTRUCTURE
50.4. DATA CENTER MARKET BY AREA
50.5. DATA CENTER MARKET BY POWER CAPACITY
50.6. DATA CENTER MARKET BY SUPPORT INFRASTRUCTURE
50.7. DATA CENTER MARKET BY IT INFRASTRUCTURE
50.8. LIST OF UPCOMING DATA CENTER PROJECTS IN APAC
51. CHINA
51.1. INVESTMENT
51.2. MARKET BY INVESTMENT
51.3. AREA
51.4. MARKET BY AREA
51.5. POWER CAPACITY
51.6. MARKET BY POWER CAPACITY
51.7. KEY SUPPORT INFRASTRUCTURE ADOPTION
51.8. MARKET BY INFRASTRUCTURE
51.9. LIST OF UPCOMING DATA CENTER PROJECTS IN CHINA
52. HONG KONG
52.1. INVESTMENT
52.2. MARKET BY INVESTMENT
52.3. AREA
52.4. MARKET BY AREA
52.5. POWER CAPACITY
52.6. MARKET BY POWER CAPACITY
52.7. KEY SUPPORT INFRASTRUCTURE ADOPTION
52.8. MARKET BY INFRASTRUCTURE
53. AUSTRALIA
53.1. INVESTMENT
53.2. MARKET BY INVESTMENT
53.3. AREA
53.4. MARKET BY AREA
53.5. POWER CAPACITY
53.6. MARKET BY POWER CAPACITY
53.7. KEY SUPPORT INFRASTRUCTURE ADOPTION
53.8. MARKET BY INFRASTRUCTURE
54. NEWZEALND
54.1. INVESTMENT
54.2. MARKET BY INVESTMENT
54.3. AREA
54.4. MARKET BY AREA
54.5. POWER CAPACITY
54.6. MARKET BY POWER CAPACITY
54.7. KEY SUPPORT INFRASTRUCTURE ADOPTION
54.8. MARKET BY INFRASTRUCTURE
55. INDIA
55.1. INVESTMENT
55.2. MARKET BY INVESTMENT
55.3. AREA
55.4. MARKET BY AREA
55.5. POWER CAPACITY
55.6. MARKET BY POWER CAPACITY
55.7. KEY SUPPORT INFRASTRUCTURE ADOPTION
55.8. MARKET BY INFRASTRUCTURE
56. JAPAN
56.1. INVESTMENT
56.2. MARKET BY INVESTMENT
56.3. AREA
56.4. MARKET BY AREA
56.5. POWER CAPACITY
56.6. MARKET BY POWER CAPACITY
56.7. KEY SUPPORT INFRASTRUCTURE ADOPTION
56.8. MARKET BY INFRASTRUCTURE
57. SOUTH KOREA
57.1. INVESTMENT
57.2. MARKET BY INVESTMENT
57.3. AREA
57.4. MARKET BY AREA
57.5. POWER CAPACITY
57.6. MARKET BY POWER CAPACITY
57.7. KEY SUPPORT INFRASTRUCTURE ADOPTION
57.8. MARKET BY INFRASTRUCTURE
58. TAIWAN
58.1. INVESTMENT
58.2. MARKET BY INVESTMENT
58.3. AREA
58.4. MARKET BY AREA
58.5. POWER CAPACITY
58.6. MARKET BY POWER CAPACITY
58.7. KEY SUPPORT INFRASTRUCTURE ADOPTION
58.8. MARKET BY INFRASTRUCTURE
59. SINGAPORE
59.1. INVESTMENT
59.2. MARKET BY INVESTMENT
59.3. AREA
59.4. MARKET BY AREA
59.5. POWER CAPACITY
59.6. MARKET BY POWER CAPACITY
59.7. KEY SUPPORT INFRASTRUCTURE ADOPTION
59.8. MARKET BY INFRASTRUCTURE
60. INDONESIA
60.1. INVESTMENT
60.2. MARKET BY INVESTMENT
60.3. AREA
60.4. MARKET BY AREA
60.5. POWER CAPACITY
60.6. MARKET BY POWER CAPACITY
60.7. KEY SUPPORT INFRASTRUCTURE ADOPTION
60.8. MARKET BY INFRASTRUCTURE
69. MALAYSIA
69.1. INVESTMENT
69.2. MARKET BY INVESTMENT
69.3. AREA
69.4. MARKET BY AREA
69.5. POWER CAPACITY
69.6. MARKET BY POWER CAPACITY
69.7. KEY SUPPORT INFRASTRUCTURE ADOPTION
69.8. MARKET BY INFRASTRUCTURE
70. THAILAND
71.1. INVESTMENT
71.2. MARKET BY INVESTMENT
71.3. AREA
71.4. MARKET BY AREA
71.5. POWER CAPACITY
71.6. MARKET BY POWER CAPACITY
71.7. KEY SUPPORT INFRASTRUCTURE ADOPTION
71.8. MARKET BY INFRASTRUCTURE
72. PHILIPPINES
72.1. INVESTMENT
72.2. MARKET BY INVESTMENT
72.3. AREA
72.4. MARKET BY AREA
72.5. POWER CAPACITY
72.6. MARKET BY POWER CAPACITY
72.7. KEY SUPPORT INFRASTRUCTURE ADOPTION
72.8. MARKET BY INFRASTRUCTURE
73. VIETNAM
73.1. INVESTMENT
73.2. MARKET BY INVESTMENT
73.3. AREA
73.4. MARKET BY AREA
73.5. POWER CAPACITY
73.6. MARKET BY POWER CAPACITY
73.7. KEY SUPPORT INFRASTRUCTURE ADOPTION
73.8. MARKET BY INFRASTRUCTURE
74. MARKET PARTICIPANTS
74.1. IT INFRASTRUCTURE PROVIDER
74.2. DATA CENTER SUPPORT INFRASTRUCTURE PROVIDERS
75.4. DATA CENTER CONTRACTORS
74.6. DATA CENTER INVESTORS
74.7. NEW ENTRANTS
75. QUANTITATIVE SUMMARY
76. APPENDIX
76.1. ABBREVIATIONS
76.2. DEFINITIONS
76.3. SEGMENTAL COVERAGE
Select a license type that suits your business needs
Single User Licence
- Report accessible by one user only
- Free 10% or 3 days of customization
- Free post-sale service assistance
- Continuous support through email
5 User Licence
- Report accessible by 5 users within the organization
- Free 15% or 4.5 days of customization
- Continuous support through email and telephone
- Free analyst hour
- Free Upgrade: If an updated report published within 180 days of purchase, you will get the revised report free of charge
Corporate Licence
- Free Datasheet worth $1500
- Report accessible by the entire organization
- Free 20% or 6 days of customization
- Free post-sale service assistance
- Continuous support through email and telephone
- Direct access to lead analysts
- Free analyst hour
- Free Upgrade: If an updated report published within 180 days of purchase, you will get the revised report free of charge
Datasheet Licence
- Report accessible by 1 user only
- Free 15% or 32 hours of customization
- Free post-sale service assistance
- Direct access to lead analysts
Frequently Asked Questions
How big is the global hyperscale data center market in terms of investments?
Which region holds the most significant global hyperscale data center market share?
What is the estimated market size in terms of area in the global hyperscale data center market by 2030?
How many MW of power capacity is expected to reach the global hyperscale data center market by 2030?
What is the growth rate of the global hyperscale data center market?


