Norway Data Center Market - Investment Analysis & Growth Opportunities 2026-2031
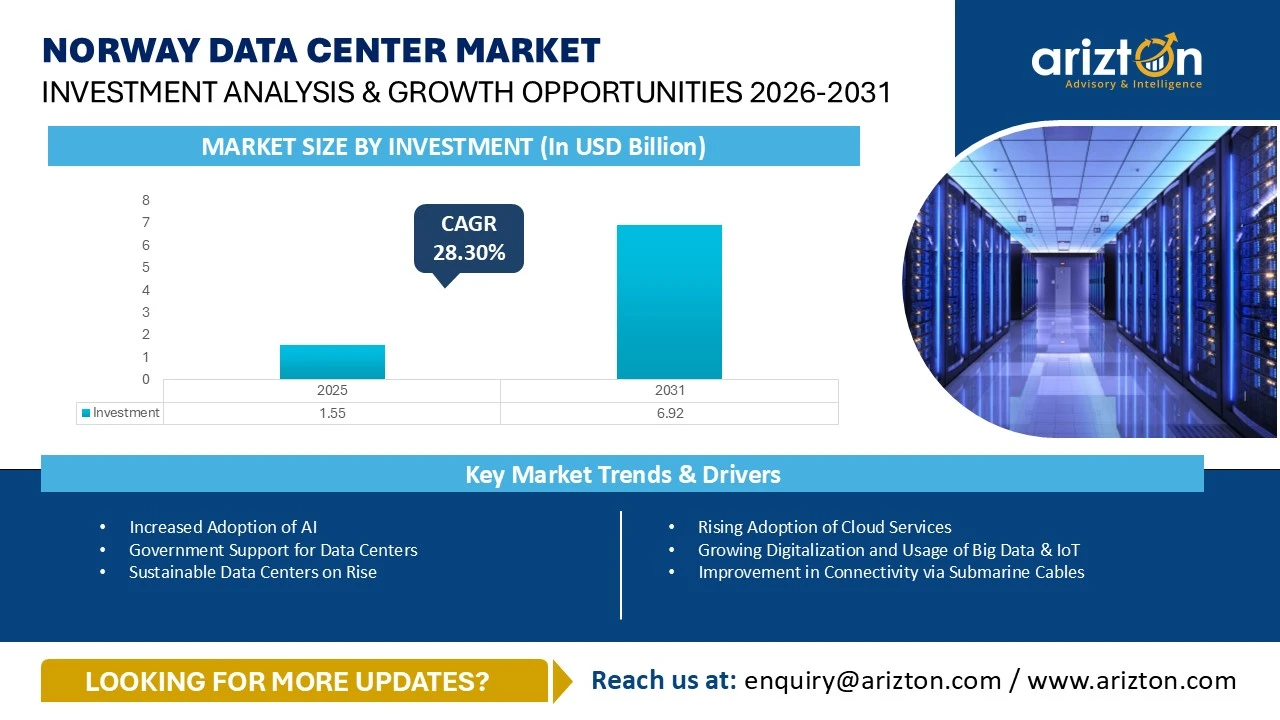
THE NORWAY DATA CENTER MARKET SIZE WAS VALUED AT USD 1.55 BILLION IN 2025 AND IS EXPECTED TO REACH USD 6.92 BILLION BY 2031, GROWING AT A CAGR OF 28.30% DURING THE FORECAST PERIOD.

127 pages
84 company
06 segments
1 region
1 countries
Purchase Options
Norway Data Center Market - Investment Analysis & Growth Opportunities 2026-2031
THE NORWAY DATA CENTER MARKET SIZE WAS VALUED AT USD 1.55 BILLION IN 2025 AND IS EXPECTED TO REACH USD 6.92 BILLION BY 2031, GROWING AT A CAGR OF 28.30% DURING THE FORECAST PERIOD.
The Norway Data Center Market Report Includes Size in Terms of
- IT Infrastructure: Servers, Storage Systems, and Network Infrastructure
- Electrical Infrastructure: UPS Systems, Generators, Transfer Switches & Switchgears, PDUs, and Other Electrical Infrastructure
- Mechanical Infrastructure: Cooling Systems, Rack Cabinets, and Other Mechanical Infrastructure
- Cooling Systems: CRAC & CRAH Units, Chiller Units, Cooling Towers, Condensers & Dry Coolers, and Other Cooling Units
- General Construction: Core & Shell Development, Installation & Commissioning Services, Engineering & Building Design, Fire Detection & Suppression Systems, Physical Security, and Data Center Infrastructure Management (DCIM)
- Tier Standard: Tier I & Tier II, Tier III, and Tier IV
Get Insights on 30 Existing Data Centers and 16 Upcoming Facilities across Norway
This report includes market data points, ranging from trend
analyses to market estimates & forecasts that you can customize
NORWAY DATA CENTER MARKET REPORT SCOPE
| REPORT ATTRIBUTE | DETAILS |
|---|---|
| MARKET SIZE (INVESTMENT) | USD 6.92 Billion (2031) |
| MARKET SIZE (AREA) | 1,050 Thousand Sq. feet (2031) |
| MARKET SIZE (POWER CAPACITY) | 300 MW (2031) |
| CAGR - INVESTMENT (2025-2031) | 28.30% |
| COLOCATION MARKET SIZE (REVENUE) | USD 1.74 Billion (2031) |
| HISTORIC YEAR | 2022-2024 |
| BASE YEAR | 2025 |
| FORECAST YEAR | 2026-2031 |
NORWAY DATA CENTER MARKET SIZE & OUTLOOK
The Norway data center market is entering a high-growth phase, backed by strong digital foundations, sustainability advantages, and rising investments from hyperscale operators. Valued at USD 1.55 billion in 2025, the market is expected to reach USD 6.92 billion by 2031, highlighting a significant shift in the Norway data center industry.
Norway is steadily positioning itself as a key Nordic hub. Its abundant renewable hydropower, naturally cool climate that supports energy-efficient operations, and strong fiber and submarine cable networks make it highly attractive. These factors are turning Norway cloud data centers and Norway hyperscale data centers into critical assets for Europe’s digital infrastructure.
The Norway data center infrastructure landscape is set to expand rapidly, supported by hyperscale cloud growth, increasing AI workloads, High-Performance Computing (HPC) demand, and rising enterprise reliance on colocation providers in Norway.
MARKET DRIVERS & INDUSTRY DYNAMICS
The growing footprint of global cloud providers such as Microsoft and Google is playing a central role in market expansion. These companies are strengthening their presence in the Nordic region to meet data sovereignty needs, improve latency, and support sustainable cloud operations. This, in turn, is driving demand for both wholesale colocation in Norway and retail colocation in Norway.
At the same time, enterprises are increasingly adopting cloud hosting in Norway and managed data center services in Norway. This shift is fueling growth in the Norway colocation market, where wholesale colocation continues to lead due to its scalability and ability to support large workloads.
POWER, REGULATORY & COST LANDSCAPE
Energy availability remains one of Norway’s strongest advantages. Hydropower continues to support sustainable and cost-efficient data center operations. However, as demand rises from Norway hyperscale data centers and large-scale colocation facilities, electricity costs are expected to gradually increase.
On the regulatory front, Norway offers a stable and secure environment. Its alignment with GDPR through the Personal Data Act ensures data protection and compliance, making it a reliable location for Norway cloud data centers and enterprise deployments. This regulatory clarity strengthens investor confidence and supports long-term growth.
TECHNOLOGY TRENDS & INNOVATION
The shift toward high-density computing is transforming the Norway data center infrastructure ecosystem. Traditional cooling methods are increasingly being replaced by advanced liquid cooling solutions to handle AI and HPC workloads efficiently.
Operators are also adopting high-density racks and modular designs to improve scalability and performance. These innovations are essential for supporting the growing demands of cloud hosting in Norway and modern enterprise applications.
CONNECTIVITY & INFRASTRUCTURE ADVANTAGE
Norway benefits from a strong and reliable connectivity network, which plays a key role in the growth of the Norway data center market. Multiple submarine cables connect the country to major European hubs, enabling fast and efficient data transfer.
Continuous investments in subsea cable systems and fiber networks are further strengthening the Norway data center infrastructure, ensuring low-latency connectivity and improved redundancy for global data traffic.
SUSTAINABILITY & ENERGY EFFICIENCY
Sustainability is at the core of the Norway data center industry. The extensive use of renewable energy, combined with innovative practices such as heat reuse, significantly improves overall efficiency and environmental performance.
These efforts align with global ESG priorities and make colocation providers in Norway an attractive choice for businesses seeking greener cloud hosting in Norway solutions.
NORWAY DATA CENTER MARKET – VENDOR LANDSCAPE
The Norway data center market is supported by a strong and evolving ecosystem of technology providers, contractors, and operators driving infrastructure growth and innovation.
IT infrastructure providers such as Arista Networks, Cisco Systems, Dell Technologies, HPE, IBM, Lenovo, NetApp, Oracle, and others are enabling scalable, AI-ready solutions across the Norway data center industry.
Construction firms including AECOM, Arup, COWI, Ramboll, Skanska, and Turner & Townsend are focusing on modular, efficient, and sustainable designs to support the rapid expansion of Norway hyperscale data centers and colocation facilities.
Support infrastructure providers like ABB, Schneider Electric, Siemens, Vertiv, Eaton, and STULZ are ensuring reliable power and cooling systems, which are essential for handling high-density workloads in Norway data center infrastructure.
The Norway colocation market is led by operators such as Bulk Infrastructure, Green Mountain, STACK Infrastructure, and Telia, offering a mix of retail colocation in Norway, wholesale colocation in Norway, and managed data center services in Norway.
New entrants, including Google, Greenscale Data Centres, and Fossefall, are further intensifying competition and bringing innovation to cloud hosting in Norway.
NORWAY DATA CENTER MARKET – KEY HIGHLIGHTS
The Norway data center market is emerging as a major Nordic hub, with around 30 operational facilities, many of which are concentrated in Oslo. Leading colocation providers in Norway, such as Green Mountain, STACK Infrastructure, and Bulk Infrastructure, are actively expanding capacity across the country.
Strong connectivity through submarine cables continues to enhance the growth of Norway cloud data centers, reinforcing Norway’s position as a strategic European data hub. Ongoing investments in subsea and fiber infrastructure are further strengthening the Norway data center infrastructure.
Sustainability remains a defining advantage, with renewable energy usage and heat reuse initiatives making operations more efficient and environmentally friendly. This strengthens the appeal of cloud hosting in Norway for global enterprises.
At the same time, the rise of AI and HPC workloads is accelerating the adoption of high-density racks and advanced cooling technologies in Norway hyperscale data centers, supporting the next generation of digital infrastructure.
EXISTING VS. UPCOMING DATA CENTERS
- Existing Facilities in the region (Area and Power Capacity)
- Oslo
- Other Cities
- List of Upcoming Facilities in the region (Area and Power Capacity)
- Oslo
- Other Cities
- Snapshot of existing and upcoming third-party data center facilities in Norway
- Facilities Covered (Existing): 30
- Facilities Identified (Upcoming): 16
- Coverage: 8+ Cities
- Existing vs. Upcoming (Data Center Area)
- Existing vs. Upcoming (IT Load Capacity)
REPORT COVERAGE:
This report analyses the Norway data center market share. It elaboratively analyses the existing and upcoming facilities and investments in IT, electrical, mechanical infrastructure, cooling systems, general construction, and tier standards. It discusses market sizing and investment estimation for different segments. The segmentation includes:
- IT Infrastructure
- Server Infrastructure
- Storage Infrastructure
- Network Infrastructure
- Electrical Infrastructure
- UPS Systems
- Generators
- Switches & Switchgears
- PDUs
- Other Electrical Infrastructure
- Mechanical Infrastructure
- Cooling Systems
- Rack Cabinets
- Other Mechanical Infrastructure
- Cooling Systems
- CRAC and CRAH
- Chillers
- Cooling Towers, Condensers and Dry Coolers
- Other Cooling Units
- General Construction
- Core & Shell Development
- Installation & commissioning Services
- Building & Engineering Design
- Fire Detection & Suppression Systems
- Physical Security
- Data Center Infrastructure Management (DCIM)
- Tier Standard
- Tier I & Tier II
- Tier III
- Tier IV
VENDOR LANDSCAPE
- IT INFRASTRUCTURE PROVIDERS: Arista Networks, Cisco Systems, Dell Technologies, Hewlett Packard Enterprise, Hitachi Vantara, Huawei Technologies, IBM, Juniper Networks, Lenovo, NetApp, NetNordic Group AS, Oracle, Pure Storage, and Super Micro Computer.
- DATA CENTER CONSTRUCTION CONTRACTORS & SUB-CONTRACTORS: AECOM, Arup, Coromatic AB, COWI, CTS Group, Designer Group, Elecnor Group, HDR Architecture, Keysource, Kirby Group Engineering, Marsh, Mecwide, Mercury, Olaris AS, Ramboll, RED Engineering Design, Rider Levett Bucknall RLB, Skanska, Sweco, Turner & Townsend, and YIT.
- SUPPORT INFRASTRUCTURE PROVIDERS: ABB, Alfa Laval, Austin Hughes Electronics, Carrier, Caterpillar, Comsys, Condair Group, Cummins, DEIF, Delta Electronics, Eaton, FläktGroup, GE Vernova, HITEC Power Protection, Johnson Controls, Rehlko, Legrand, Mitsubishi Electric, Perkins Engine, Piller Power Systems, Rittal, Rolls-Royce, Schneider Electric, Siemens, Socomec Group, STULZ, Swegon, Trane Technologies, and Vertiv.
- DATA CENTER INVESTORS: AQ Compute, ASP Data Center, Blix Solutions AS, Bluefjords, Bulk Infrastructure, Gigahost AS, Green Mountain, Itsjefen, Lefdal Mine Data Centers, Lunar Digital, Nscale, Orange Business, STACK Infrastructure, STORESPEED, Telia, Terakraft, and Vaultica Data Centers.
- NEW ENTRANTS: Fossefall, Google, Greenscale Data Centres, and Keysource & Namsos DataSenter.
SNAPSHOT
The Norway data center market size is projected to reach USD 6.92 billion by 2031, growing at a CAGR of 28.30% from 2025 to 2031.
The following factors are likely to contribute to the growth of the Norway data center market
- Rising Adoption of Cloud Services
- Growing Digitalization and Usage of Big Data & IoT
- Improvement in Connectivity via Submarine Cables
- Growing Submarine and Inland Connectivity
Base Year: 2025
Forecast Year: 2026-2031
The report considers the present scenario of the Norway data center market and its market dynamics for 2026-2031. It covers a detailed overview of several market growth enablers, restraints, and trends. The study includes the demand and supply aspects of the market.
This report also analyses the Norway data center market share. It elaborately analyses the existing and upcoming facilities and investments in IT, electrical, mechanical infrastructure, general construction, and tier standards. It discusses market sizing and investment estimation for different segments.
The segmentation includes:
- IT Infrastructure
- Servers
- Storage Systems
- Network Infrastructure
- Electrical Infrastructure
- UPS Systems
- Generators
- Transfer Switches & Switchgears
- PDUs
- Other Electrical Infrastructure
- Mechanical Infrastructure
- Cooling Systems
- Rack Cabinets
- Other Mechanical Infrastructure
- Cooling Systems
- CRAC & CRAH Units
- Chiller Units
- Cooling Towers, Condensers & Dry Coolers
- Other Cooling Units
- General Construction
- Core & Shell Development
- Installation & Commissioning Services
- Engineering & Building Design
- Fire Detection & Suppression Systems
- Physical Security
- Data Center Infrastructure Management (DCIM)
- Tier Standard
- Tier I & Tier II
- Tier III
- Tier IV
VENDOR LANDSCAPE
IT Infrastructure Providers
- Arista Networks
- Cisco Systems
- Dell Technologies
- Hewlett Packard Enterprise
- Hitachi Vantara
- Huawei Technologies
- IBM
- Juniper Networks
- Lenovo
- NetApp
- NetNordic Group AS
- Oracle
- Pure Storage
- Super Micro Computer
Data Center Construction Contractors & Sub-Contractors
- AECOM
- Arup
- Coromatic AB
- COWI
- CTS Group
- Designer Group
- Elecnor Group
- HDR Architecture
- Keysource
- Kirby Group Engineering
- Marsh
- Mecwide
- Mercury
- Olaris AS
- Ramboll
- RED Engineering Design
- Rider Levett Bucknall RLB
- Skanska
- Sweco
- Turner & Townsend
- YIT
Support Infrastructure Providers
- ABB
- Alfa Laval
- Austin Hughes Electronics
- Carrier
- Caterpillar
- Comsys
- Condair Group
- Cummins
- DEIF
- Delta Electronics
- Eaton
- FläktGroup
- GE Vernova
- HITEC Power Protection
- Johnson Controls
- Rehlko
- Legrand
- Mitsubishi Electric
- Perkins Engine
- Piller Power Systems
- Rittal
- Rolls-Royce
- Schneider Electric
- Siemens
- Socomec Group
- STULZ
- Swegon
- Trane Technologies
- Vertiv
Data Center Investors
- AQ Compute
- ASP Data Center
- Blix Solutions AS
- Bluefjords
- Bulk Infrastructure
- Gigahost AS
- Green Mountain
- Itsjefen
- Lefdal Mine Data Centers
- Lunar Digital
- Nscale
- Orange Business
- STACK Infrastructure
- STORESPEED
- Telia
- Terakraft
- Vaultica Data Centers
New Entrants
- Fossefall
- Greenscale Data Centres
- Keysource & Namsos DataSenter
NORWAY DATA CENTER MARKET FAQs
How big is the Norway data center market?
How much MW of power capacity will be added across Norway during 2026-2031?
What factors are driving the Norway data center market?
Which cities are included in Norway center market report?
For more details, please reach us at [email protected]
For more details, please reach us at [email protected]
Select a license type that suits your business needs
Single User Licence
- Report accessible by one user only
- Free 10% or 3 days of customization
- Free post-sale service assistance
- Continuous support through email
5 User Licence
- Report accessible by 5 users within the organization
- Free 15% or 4.5 days of customization
- Continuous support through email and telephone
- Free analyst hour
- Free Upgrade: If an updated report published within 180 days of purchase, you will get the revised report free of charge
Corporate Licence
- Free Datasheet worth $1500
- Report accessible by the entire organization
- Free 20% or 6 days of customization
- Free post-sale service assistance
- Continuous support through email and telephone
- Direct access to lead analysts
- Free analyst hour
- Free Upgrade: If an updated report published within 180 days of purchase, you will get the revised report free of charge
Datasheet Licence
- Report accessible by 1 user only
- Free 15% or 32 hours of customization
- Free post-sale service assistance
- Direct access to lead analysts
Frequently Asked Questions
How big is the Norway data center market?
How much MW of power capacity will be added across Norway during 2026-2031?
What factors are driving the Norway data center market?
Which cities are included in Norway center market report?
Other RELATED Reports
Iceland Data Center Market – Investment Analysis & Growth Opportunities 2026-2031
Published : April 2026
Denmark Data Center Market – Investment Analysis & Growth Opportunities 2026-2031
Published : April 2026

United Kingdom Data Center Market - Investment Analysis & Growth Opportunities 2025-2030
Published : February 2025
Switzerland Data Center Colocation Market – Supply & Demand Analysis 2025-2030
Published : November 2025