Global Sportswear Market Research Report 2026-2031
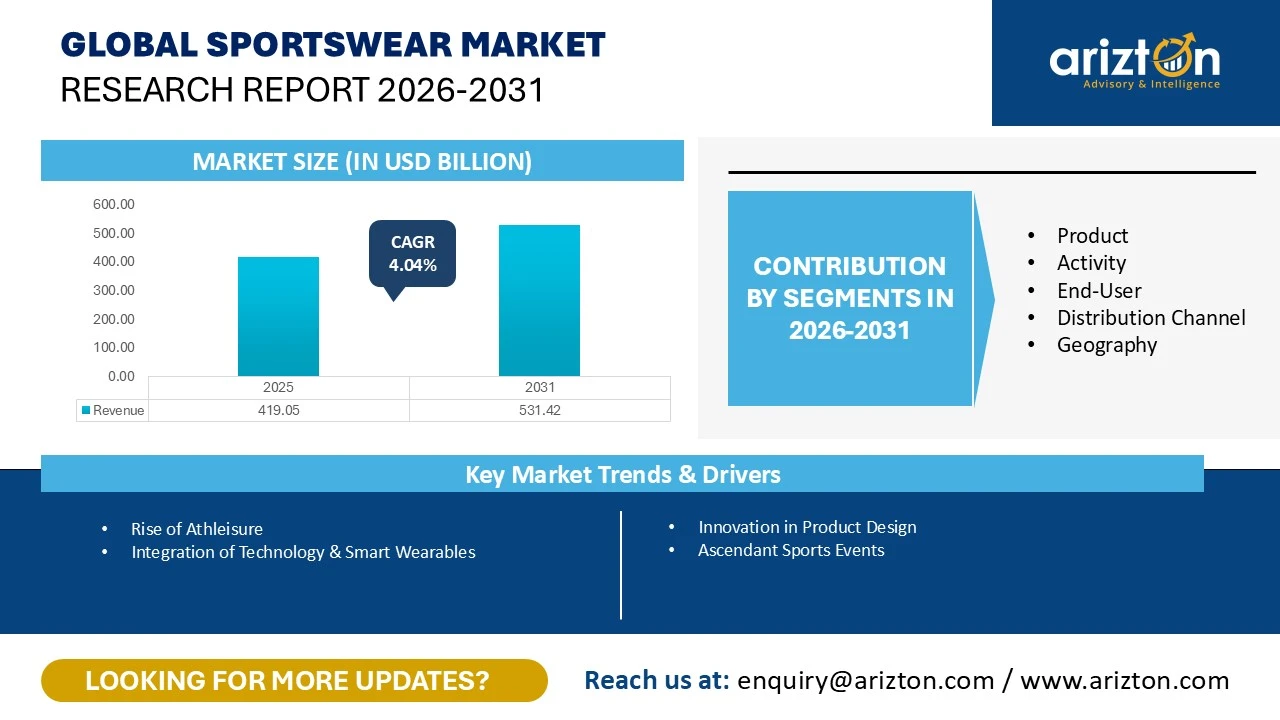
THE GLOBAL SPORTSWEAR MARKET WAS VALUED AT USD 419.05 BILLION IN 2025 AND IS PROJECTED TO REACH USD 531.42 BILLION BY 2031, GROWING AT A CAGR OF 4.04%.

155 pages
6 tables
44 charts
5 region
22 countries
61 company
4 segments
Purchase Options
Global Sportswear Market Research Report 2026-2031
THE GLOBAL SPORTSWEAR MARKET WAS VALUED AT USD 419.05 BILLION IN 2025 AND IS PROJECTED TO REACH USD 531.42 BILLION BY 2031, GROWING AT A CAGR OF 4.04%.
The Sportswear Market Size, Share & Trends Analysis Report By
- Product: Apparel and Footwear & Accessories
- Activity: Sports, Training & Yoga, Swimming, and Others
- End-User: Male, Female, and Children
- Distribution Channel: Wholesale and Direct-to-Consumer
- Geography: North America, Europe, APAC, Latin America, and Middle East & Africa
Industry Analysis Report, Regional Outlook, Growth Potential, Price Trends, Competitive Market Share & Forecast 2026–2031.
This report includes market data points, ranging from trend
analyses to market estimates & forecasts that you can customize
SPORTSWEAR MARKET REPORT SCOPE
| REPORT ATTRIBUTE | DETAILS |
|---|---|
| MARKET SIZE (2031) | USD 531.42 Billion |
| MARKET SIZE (2025) | USD 419.05 Billion |
| CAGR (2025-2031) | 4.04%. |
| HISTORIC YEAR | 2022-2024 |
| BASE YEAR | 2025 |
| FORECAST YEAR | 2026-2031 |
| SEGMENTS BY | Product, Activity Type, End-User, Distribution Channel, and Geography |
| GEOGRAPHIC ANALYSIS | North America, Europe, APAC, Latin America, & Middle East & Africa |
| KEY PLAYERS | Nike Inc, Adidas, ANTA Sports Goods, Lululemon Athletica Inc, and PUMA |
SPORTSWEAR MARKET SIZE & SHARE
The global sportswear market size was valued at USD 419.05 billion in 2025 and is projected to reach USD 531.42 billion by 2031, growing at a CAGR of 4.04% during the forecast period. The market is experiencing strong growth, driven by the integration of advanced technology and smart wearables, the continued rise of athleisure, and increasing focus on sustainability in sportswear development. Innovation in product design, the influence of major sporting events, and growing health and fitness awareness among consumers are further accelerating market expansion. A key trend shaping the industry is the embedding of biometric sensors into clothing, enabling continuous monitoring of metrics such as heart rate and body alignment during movement. Additionally, digital tools are empowering brands to deliver custom-fit apparel and personalized design features tailored to individual user preferences.
At the same time, advancements in manufacturing technologies are redefining product development and performance optimization. The adoption of 3D printing is enabling rapid prototyping and the creation of personalized midsoles designed to match an individual’s unique walking pattern and foot structure. Furthermore, integrated sensors within insoles provide data-driven insights into running mechanics, offering real-time mapping of weight distribution. These innovations are not only enhancing athletic performance but also reinforcing the shift toward highly customized, technology-driven sportswear solutions.
Recent Developments in the Sportswear Market
- In March 2026, The LEGO Group and Nike are expanding their worldwide collaboration with the launch of the Nike Air Max 95 x LEGO Collection, bringing together a separate LEGO brick and the Air Max 95 Big Bubble sneaker set as the next evolution of their global partnership.
- In March 2026, Adidas introduced the Supernova Rise 3 Adaptive, marking the brand’s debut in high-performance running footwear created specifically for and alongside the para-athlete community.
- By the end of 2026, the prominent Canadian sportswear firm Lululemon is set to enter the Indian market. This expansion is being facilitated through a franchise partnership with the Tata Group's e-commerce platform, Tata CLiQ.
SPORTSWEAR MARKET TRENDS
Integration of Technology & Smart Wearables
Integration of technology & smart wearables is a key trend in the global sportswear market. By incorporating smart sensors and embedded hardware, sportswear has evolved from basic clothing into a sophisticated data-gathering instrument. This transition is ushering in an era of active intelligence, where garments serve as real-time monitors for an athlete's health and physical output. Today's athletes, from professionals to enthusiasts, expect immediate data. Intelligent gear now monitors form, such as lifting technique or running mechanics, to mitigate injury risks and refine movement as it happens. There is a growing consumer demand for granular health data, including recovery and sleep quality. By embedding sensors directly into E-textiles, brands can offer a frictionless data-collection experience that surpasses the convenience of traditional, external wearables.
Rise of Athleisure
The rise of athleisure is a major trend in the global sportswear market. Athleisure bridges the gap between the gym and the street, providing a versatile wardrobe for the modern, active consumer. It represents a shift toward clothing that prioritizes both aesthetics and movement, making workout clothes acceptable for nearly any casual occasion. Advanced fabric technologies such as four-way stretch, moisture management, and anti-microbial treatments have made athletic wear more appealing for daily use than traditional denim or wool. The Gorpcore trend has turned rugged outdoor gear like technical shells and hiking footwear from brands like Salomon and Arc'teryx into a high-fashion staple for urban environments.
SPORTSWEAR MARKET DRIVERS
Innovation in Product Design
Innovation in product design pivotal driver in the global sportswear market. It provides quantifiable performance gains that support premium price points and cultivate deep brand affinity. By addressing specific athletic pain points with exclusive textiles and patented technologies, companies establish a significant competitive edge and set new benchmarks for the entire industry. Product development has moved beyond simple visual styling into a competitive "arms race" centered on biomechanics and material science. Today, sportswear brands have transitioned from apparel makers to high-performance equipment engineers. The adoption of 3D printing and digital knitting has enabled mass customization. Footwear and apparel can now be precisely engineered to match a user’s unique weight, gait, and pressure distribution. Innovation in high-tenacity yarns provides elite athletes with maximum support at a fraction of the traditional weight.
Ascendant Sports Events
Ascendant sports events are a key growth catalyst, driven by the surge in consumer participation, athlete influence & brand marketing, medial & social media amplification, and government & infrastructure push. Emerging sports, defined by their soaring popularity and cultural relevance, are now the major drivers of growth for the sportswear market. In contrast to established major tournaments, these rising activities resonate with Gen Z and niche lifestyle communities, fostering lucrative new opportunities in specialized retail. Professional leagues and increased participation have created a dedicated, high-growth revenue stream for specialized women’s gear. The events reach a billion viewers globally, which can create an instant demand spike. The growing amateur & marathon events across the world increase the participation, which in turn increases the demand for sportswear.
INDUSTRY RESTRAINTS
Easy Availability of Counterfeit Products
Easy availability of counterfeit products is a major challenge in the global sportswear market. Proliferating fakes significantly devalue the legitimate sportswear market and put users at risk. Beyond mere enforcement, there is a pressing need to shift consumer mindsets toward valuing authenticity. Solving this challenge is a prerequisite for protecting a brand’s intellectual property and ensuring the well-being of its customers.
SPORTSWEAR MARKET SEGMENTATION INSIGHTS
INSIGHT BY PRODUCT
The sportswear market by product is segmented into apparel and footwear & accessories. The apparel segment accounted for the largest market share of around 55% in 2025, driven by multiple factors, including advancements in fabric engineering, the growing integration of athleisure, strong social media influence, sustainability mandates, rapid urbanization, expanding e-commerce accessibility, and the rise of adaptive sportswear. Continuous technical improvements in areas such as sweat management, compression levels, and thermal regulation are helping brands justify premium pricing while also encouraging repeat purchases. In parallel, marketing strategies centred around lifestyle and fitness influencers on platforms like TikTok and Instagram are significantly accelerating buying trends and shortening product cycles.
Additionally, shifting consumer lifestyles are further strengthening the dominance of the apparel segment. The increasing participation of women in fitness activities such as gym workouts, Pilates, and yoga is fueling rapid market growth. As the line between athletic wear and everyday clothing continues to blur, products like joggers and leggings have evolved into daily fashion essentials. At the same time, modern consumers are showing a clear preference for sustainable options, with rising demand for apparel made from organic cotton and recycled polyester, reflecting a broader shift toward environmentally conscious purchasing behaviour.
INSIGHTS BY ACTIVITY TYPE
In 2025, the sports activity segment holds the highest share of revenue in the global sportswear market, driven by factors such as strong athlete endorsements, rising professionalism in youth sports, expanding government-backed sports initiatives, the integration of digital training technologies, and the global impact of major sporting events. High-profile tournaments like the FIFA World Cup and the Olympics create substantial spikes in demand for professional gear and team-branded apparel. At the same time, large-scale government investments, such as China’s multi-billion-dollar “Strong Sports Nation” initiative, are significantly boosting grassroots participation and increasing demand for sports equipment.
In addition, the growing presence of elite sports academies and competitive school programs is encouraging young athletes to adopt professional-grade gear at earlier stages of their development. Continuous innovation in sports equipment, including advancements like high-traction soccer cleats and carbon-plated footwear, is further driving market growth by motivating serious athletes to frequently upgrade their performance gear
INSIGHTS BY END-USER
In 2025, the male segment held the highest share of revenue in the end-user sportswear market due to high participation in sports. Furthermore, driven by factors such as increasing health consciousness, expanding career and lifestyle opportunities, the growing adoption of athleisure wear, emerging fashion trends, and rising demand for premium products. Popular product categories among men include athletic shorts, t-shirts, hoodies, track pants, athletic footwear, and sports-specific apparel such as jerseys and compression gear, all of which contribute to sustained market demand.
At the same time, male consumers are increasingly seeking sportswear that not only enhances performance but also aligns with their personal style and fashion preferences. This convergence of fashion and functionality has significantly broadened the appeal of sportswear, transforming it into an everyday wardrobe essential. As a result, brands are focusing on innovative designs, premium materials, and style-driven offerings to capture a larger share of this expanding consumer base.
INSIGHTS BY DISTRIBUTION CHANNEL
The wholesale segment dominates the distribution channel segmentation of the global sportswear market, largely due to consumer preference for multi-brand retail environments where products from leading brands like Nike, Adidas, and New Balance can be compared side by side before purchase. Specialized retail outlets, including outdoor and running boutiques, further strengthen this segment by offering knowledgeable staff who provide technical guidance, helping to drive high-value performance product sales. Additionally, flexible payment options such as “buy-now-pay-later” and point-of-sale financing offered by retail partners make premium sportswear more accessible to a broader consumer base.
SPORTSWEAR MARKET GEOGRAPHICAL ANALYSIS
North America dominates the global sportswear market, accounting for a share of over 39%, with growth increasingly driven by strategies focused on encouraging existing customers to upgrade to smart, performance-enhanced, and sustainable products. As the market matures, the emphasis has shifted from acquiring first-time buyers to driving replacement cycles and premiumization. A major catalyst for upcoming demand is the 2026 FIFA World Cup, which will be the first edition hosted across three countries and the first in the region in over three decades. With FIFA projecting nearly 6 billion viewers, the event is expected to create significant commercial opportunities, particularly for fan gear such as official kits and branded accessories.
At the country level, strong sports cultures continue to reinforce regional dominance. Canada benefits from a well-established outdoor lifestyle, with activities like skiing, snowboarding, and hockey driving demand for specialized sportswear. Meanwhile, in the United States, major professional leagues such as the NFL, NBA, and MLB play a critical role in fueling demand for fan merchandise, team jerseys, and athletic apparel. Together, these factors continue to sustain North America’s leading position in the global sportswear market.
The Asia-Pacific (APAC) region is one of the fastest-growing markets in the global sportswear industry, led by key countries such as China, India, and Japan. Market growth in the region is primarily driven by rapid urbanization and the widespread adoption of e-commerce platforms, which have significantly improved product accessibility and consumer reach. Additionally, emerging economies such as Indonesia and Australia are experiencing strong economic expansion, further supporting increased consumer spending on sportswear and fitness-related products.
VENDOR LANDSCAPE
The global sportswear market is a highly fragmented landscape. The market is fragmented due to the presence of local and international market players. Some key leading vendors in the market are NIKE, Adidas, Lululemon Athletica, PUMA, ANTA Sports Goods, and others. The competition among these players is intense. There is significant competition among the regional and national players in the global sportswear market. The competition in this market is majorly driven by branding strategies, athlete endorsements, and continuous product innovation, with the vendors investing heavily in marketing to strengthen their customer loyalty and brand visibility across the globe. The rapidly changing technological environment could adversely affect vendors as customers expect continual innovations and upgrades in sportswear. The present scenario forces vendors to alter and refine their unique value proposition to achieve a strong market presence. The vendors are increasingly moving towards the DTC models by leveraging e-commerce and digital platforms to enhance customer engagement and improve margins.
SNAPSHOT
The global sportswear market size is expected to grow at a CAGR of approximately 4.04% from 2025 to 2031.
The following factors are likely to contribute to the growth of the global sportswear market during the forecast period:
- Innovation in Product Design
- Ascendant Sports Events
- Rising Health and Fitness Awareness
Base Year: 2025
Forecast Year: 2026-2031
The report examines the current state of the global sportswear market and its market dynamics through 2026−2031. It covers a detailed overview of several market growth enablers, restraints, and trends. The study covers both the demand and supply sides of the market. It also profiles and analyses leading companies and several other prominent companies operating in the market.
Key Vendors
- Nike Inc
- Adidas
- ANTA Sports Goods
- Lululemon Athletica Inc
- PUMA
Other Prominent Vendors
- ASICS Corporation
- Columbia Sportswear Company
- Gildan Activewear
- New Balance
- Page Industries
- Amer Sports
- On Holding AG
- Under Armour, Inc.
- VF Corporation
- Deckers Brands
- Alcis Sports
- Allbirds
- Authentic Brands Group LLC
- BROOKS BROTHERS GROUP
- Brunotti
- Castore
- CAVA Athleisure Pvt Ltd
- Chkokko
- COSCO
- Decathlon
- Delta Galil Industries Ltd
- EDELRID GmbH & Co. KG
- Errea Sport Spa
- Everlast Worldwide
- F&F Holdings Corp
- Fruit of the Loom
- Goldbergh
- Goldwin
- HRX
- Hummel
- Iconix International
- Kappa
- K-Swiss
- Life is Good
- Lotto Sport Italia
- Mizuno Corporation
- New Era Cap
- Ningbo Yinshan Garments Factory
- Niviasports
- Oakley, Inc.
- Outdoor Voices
- P.E Nation
- Patagonia, Inc
- Pentland Brands Limited
- PVH Corp
- Ralph Lauren Corporation
- Recreational Equipment
- SKECHERS USA, Inc.
- The Gap, Inc.
- REV'IT! Sport International
- Sareen Sports Industries
- Saucony
- Sergio Tacchini
- Shivnaresh Sports Pvt Ltd
- Tripulse
- TYKA Sports
Segmentation by Product
- Apparel
- Footwear and Accessories
Segmentation by Activity Type
- Sports
- Training and Yoga
- Swimming
- Others
Segmentation by End-User
- Male
- Female
- Children
Segmentation by Distribution Channel
- Online
- Offline
Segmentation by Geography
- North America
- US
- Canada
- APAC
- China
- India
- Japan
- Australia
- South Korea
- Indonesia
- Europe
- Germany
- UK
- France
- Italy
- Spain
- Netherlands
- Poland
- Latin America
- Brazil
- Mexico
- Argentina
- Middle East & Africa
- Saudi Arabia
- UAE
- South Africa
- Egypt
SPORTSWEAR MARKET FAQs
How big is the global sportswear market?
Which region dominates the global sportswear market share?
Who are the key players in the global sportswear market?
What is the growth rate of the global sportswear market?
What are the significant trends in the sportswear industry?
EXHIBIT 1 Global Sportswear Market 2022-2031 ($ billion)
EXHIBIT 2 Global Sportswear Market by Product 2022-2031 ($ billion)
EXHIBIT 3 Market by Apparel 2022-2031 ($ billion)
EXHIBIT 4 Market by Footwear & Accessories 2022-2031 ($ billion)
EXHIBIT 5 Global Sportswear Market by Activity 2022-2031 ($ billion)
EXHIBIT 6 Market by Sports 2022-2031 ($ billion)
EXHIBIT 7 Market by Training & Yoga 2022-2031 ($ billion)
EXHIBIT 8 Market by Swimming 2022-2031 ($ billion)
EXHIBIT 9 Market by Others 2022-2031 ($ billion)
EXHIBIT 10 Global Sportswear Market by End-User 2022-2031 ($ billion)
EXHIBIT 11 Market by Male 2022-2031 ($ billion)
EXHIBIT 12 Market by Female 2022-2031 ($ billion)
EXHIBIT 13 Market by Others 2022-2031 ($ billion)
EXHIBIT 14 Global Sportswear Market by Distribution Channel 2022-2031 ($ billion)
EXHIBIT 15 Market by Wholesale 2022-2031 ($ billion)
EXHIBIT 16 Market by Direct-to-Consumer 2022-2031 ($ billion)
EXHIBIT 17 Global Sportswear Market by Geography 2022-2031 ($ billion)
EXHIBIT 18 North America SPORTSWEAR Market 2022-2031 ($ billion)
EXHIBIT 19 US SPORTSWEAR Market 2022-2031 ($ billion)
EXHIBIT 20 Canada SPORTSWEAR Market 2022-2031 ($ billion)
EXHIBIT 21 APAC SPORTSWEAR Market 2022-2031 ($ billion)
EXHIBIT 22 China SPORTSWEAR Market 2022-2031 ($ billion)
EXHIBIT 23 India SPORTSWEAR Market 2022-2031 ($ billion)
EXHIBIT 24 Japan SPORTSWEAR Market 2022-2031 ($ billion)
EXHIBIT 25 Australia SPORTSWEAR Market 2022-2031 ($ billion)
EXHIBIT 26 South Korea SPORTSWEAR Market 2022-2031 ($ billion)
EXHIBIT 27 Indonesia SPORTSWEAR Market 2022-2031 ($ billion)
EXHIBIT 28 Europe SPORTSWEAR Market 2022-2031 ($ billion)
EXHIBIT 29 Germany SPORTSWEAR Market 2022-2031 ($ billion)
EXHIBIT 30 UK SPORTSWEAR Market 2022-2031 ($ billion)
EXHIBIT 31 France SPORTSWEAR Market 2022-2031 ($ billion)
EXHIBIT 32 Italy SPORTSWEAR Market 2022-2031 ($ billion)
EXHIBIT 33 Spain SPORTSWEAR Market 2022-2031 ($ billion)
EXHIBIT 34 Netherlands SPORTSWEAR Market 2022-2031 ($ billion)
EXHIBIT 35 Poland SPORTSWEAR Market 2022-2031 ($ billion)
EXHIBIT 36 Latin America SPORTSWEAR Market 2022-2031 ($ billion)
EXHIBIT 37 Brazil SPORTSWEAR Market 2022-2031 ($ billion)
EXHIBIT 38 Mexico SPORTSWEAR Market 2022-2031 ($ billion)
EXHIBIT 39 Argentina SPORTSWEAR Market 2022-2031 ($ billion)
EXHIBIT 40 Middle East & Africa SPORTSWEAR Market 2022-2031 ($ billion)
EXHIBIT 41 Saudi Arabia SPORTSWEAR Market 2022-2031 ($ billion)
EXHIBIT 42 UAE SPORTSWEAR Market 2022-2031 ($ billion)
EXHIBIT 43 South Africa SPORTSWEAR Market 2022-2031 ($ billion)
EXHIBIT 44 Egypt SPORTSWEAR market 2022-2031 ($ billion)
LIST OF TABLES
TABLE 1Global SPORTSWEAR Market 2022-2031 ($ billion)
TABLE 2Global SPORTSWEAR Market by Product segmentation 2022-2031 ($ billion)
TABLE 3Global SPORTSWEAR Market by Activity segmentation 2022-2031 ($ billion)
TABLE 4Global SPORTSWEAR Market by End-User segmentation 2022-2031 ($ billion)
TABLE 5Global SPORTSWEAR Market by Distribution Channel segmentation 2022-2031 ($ billion)
TABLE 6Global SPORTSWEAR Market by Geography 2022-2031 ($ billion)
CHAPTER – 1: Global Sportswear Market Overview
- Executive Summary
- Key Findings
- Key Developments
CHAPTER – 2: Global Sportswear Market Segmentation Data
- Product Market Insights (2022-2031)
- Apparel
- Footwear & Accessories
- Activity Market Insights (2022-2031)
- Sports
- Training & Yoga
- Swimming
- Others
- End-User Market Insights (2022-2031)
- Male
- Female
- Children
- Distribution Channel Market Insights (2022-2031)
- Wholesale
- Direct-to-Consumer
CHAPTER – 3: Global Sportswear Market Prospects & Opportunities
- Global Sportswear Market Drivers
- Global Sportswear Market Trends
- Global Sportswear Market Constraints
CHAPTER – 4: Global Sportswear Market Overview
- Global Sportswear Market -Competitive Landscape
- Global Sportswear Market - Key Players
- Global Sportswear Market - Key Company Profiles
CHAPTER – 5: Appendix
- Research Methodology
- Abbreviations
- Arizton
Select a license type that suits your business needs
Single User Licence
- Report accessible by one user only
- Free 10% or 3 days of customization
- Free post-sale service assistance
- Continuous support through email
5 User Licence
- Report accessible by 5 users within the organization
- Free 15% or 4.5 days of customization
- Continuous support through email and telephone
- Free analyst hour
- Free Upgrade: If an updated report published within 180 days of purchase, you will get the revised report free of charge
Corporate Licence
- Free Datasheet worth $1500
- Report accessible by the entire organization
- Free 20% or 6 days of customization
- Free post-sale service assistance
- Continuous support through email and telephone
- Direct access to lead analysts
- Free analyst hour
- Free Upgrade: If an updated report published within 180 days of purchase, you will get the revised report free of charge
Datasheet Licence
- Report accessible by 1 user only
- Free 15% or 32 hours of customization
- Free post-sale service assistance
- Direct access to lead analysts
Frequently Asked Questions
How big is the global sportswear market?
Which region dominates the global sportswear market share?
Who are the key players in the global sportswear market?
What is the growth rate of the global sportswear market?
What are the significant trends in the sportswear industry?