Agriculture Tractor Market Research Report 2026-2031
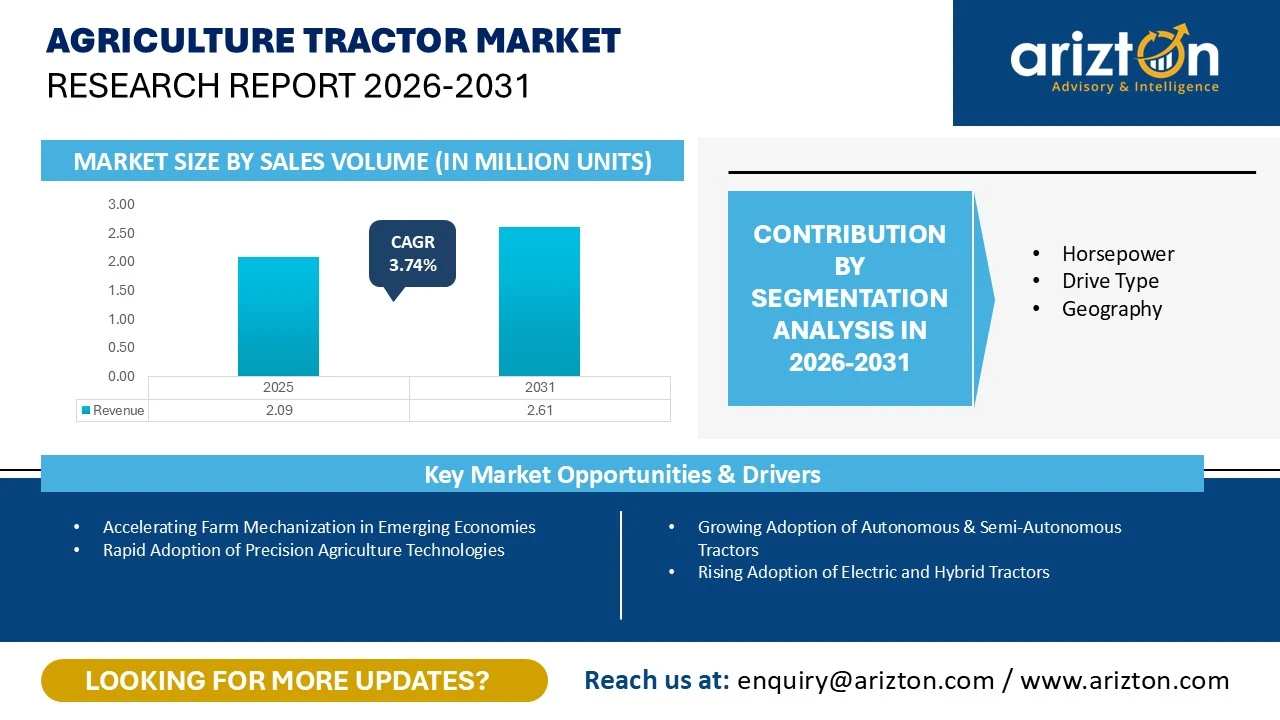
THE GLOBAL AGRICULTURE TRACTOR MARKET SIZE WAS VALUED AT 2.09 MILLION UNITS IN 2025 AND IS EXPECTED TO REACH 2.61 MILLION UNITS BY 2031, GROWING AT A CAGR OF 3.74% DURING THE FORECAST PERIOD.

Global Agriculture Tractor Market Growth Insights – Tractor Sales to Reach 2.61 Million Units by 2031, Driven by Strong Demand in China & India, Expanding Agricultural Mechanization, Rising Farm Productivity Needs, and Growing Adoption of Compact & Affordable Tractors Across Global Farming Markets (2026–2031)
To Be Published : July 2026
Last Updated : July 2026
format: PDF
edition : Fourth Edition
194 pages
25 company
3 segments
5 region
22 countries
Purchase Options
Agriculture Tractor Market Research Report 2026-2031
THE GLOBAL AGRICULTURE TRACTOR MARKET SIZE WAS VALUED AT 2.09 MILLION UNITS IN 2025 AND IS EXPECTED TO REACH 2.61 MILLION UNITS BY 2031, GROWING AT A CAGR OF 3.74% DURING THE FORECAST PERIOD.
The Global Agriculture Tractor Market Size, Share, and Trends Analysis Report By:
- Horsepower: Less Than 50 HP, 50-100 HP, and Above 100 HP
- Wheel Drive: 2-Wheel-Drive and 4-Wheel-Drive
- Geography: North America, Europe, APAC, Latin America, and Middle East & Africa
Industry Analysis Report, Regional Outlook, Growth Potential, Price Trends, Competitive Market Share & Forecast, 2026–2031
This report includes market data points, ranging from trend
analyses to market estimates & forecasts that you can customize
AGRICULTURE TRACTOR MARKET REPORT SCOPE
| REPORT ATTRIBUTE | DETAILS |
|---|---|
| MARKET SIZE (2031) | 2.61 Million Units |
| MARKET SIZE (2025) | 2.09 Million Units |
| CAGR (2025-2031) | 3.74% |
| HISTORIC YEAR | 2022-2024 |
| BASE YEAR | 2025 |
| FORECAST YEAR | FORECAST YEAR |
| SEGMENTS BY | Horsepower, Drive Type, and Geography |
| LARGEST SEGMENT BY HORSEPOWER | Less Than 50 HP |
| LARGEST SEGMENT BY DRIVE TYPE | 2-Wheel-Drive |
| LARGEST SEGMENT BY GEOGRAPHY | APAC |
| KEY VENDORS | John Deere, CNH Industrial, AGCO Corporation, Mahindra Tractors, and Kubota Corporation |
| GEOGRAPHICAL ANALYSIS | North America, Europe, APAC, Latin America, and Middle East & Africa |
AGRICULTURE TRACTOR MARKET SIZE & SHARE
The global agriculture tractor market size was valued at 2.09 million units in 2025 and is expected to reach 2.61 million units by 2031, growing at a CAGR of 3.74% during the forecast period. China and India remained the world’s two largest tractor markets, together representing about half of global tractor sales by volume. Their leadership is supported by large agricultural sectors, sizeable rural populations, and many small and medium-sized farms that need compact, affordable tractors.
Tractors sold in India, China, and much of Asia-Pacific generally have lower horsepower and prices than those used in large-scale commercial farming regions such as the US, Brazil, Russia, and Western Europe. Demand in these markets is mainly driven by small landholdings, routine farm work, and cost-sensitive buyers.
The low-horsepower tractor segment grew steadily in 2025, supported by demand from small-scale farmers, and livestock operators. These tractors remain popular for their affordability, versatility, lower operating costs, and suitability for a wide range of agricultural and utility tasks.
Demand for high-horsepower tractors remained stable as large-scale commercial farmers invested cautiously amid economic uncertainty and volatile commodity prices.
AGRICULTURE TRACTOR MARKET OPPORTUNITY
Growing Adoption of Autonomous & Semi-Autonomous Tractors
- Autonomous and driver-optional tractors are emerging as one of the most important trends in the global tractor market. These machines use technologies such as GPS-RTK positioning, computer vision, sensors, and artificial intelligence (AI) to navigate fields, avoid obstacles, and carry out tasks such as planting, tillage, and spraying more efficiently.
- As technology continues to improve and regulations for autonomous farm machinery become more established, the adoption of autonomous and driver-optional tractors is expected to increase significantly over the coming years.
Increasing Integration of IoT, Telematics, and Connected Farming Solutions
- The adoption of Internet of Things (IoT), telematics, and connected farming technologies is becoming a major trend in the global tractor market.
- Modern tractors are connected to digital farm management systems that provide real-time information on machine performance, fuel consumption, field operations, and equipment health. This connectivity helps farmers improve productivity, reduce operating costs, and make better farming decisions.
- Manufacturers are also expanding their digital services by offering remote diagnostics, software updates, fleet management solutions, and subscription-based data services. These connected solutions are especially valuable for large farms and equipment rental companies that manage multiple tractors across different locations.
AGRICULTURE TRACTOR MARKET DRIVERS
Accelerating Farm Mechanization in Emerging Economies
- Farm mechanization is one of the key factors driving the growth of the global tractor market, particularly in emerging economies across Asia, Africa, and Latin America. Many of these countries still have lower levels of agricultural mechanization compared to developed markets, creating significant opportunities for tractor adoption.
- As mechanization continues to expand across developing regions, tractors are becoming an essential part of modern farming, making accelerating farm mechanization one of the strongest long-term growth drivers for the global tractor market.
- The fragmented nature of farmland in many emerging economies is increasing demand for compact and medium-horsepower tractors that are better suited for smaller fields while offering higher operational efficiency.
Rapid Adoption of Precision Agriculture Technologies
- The increasing adoption of precision agriculture is becoming a major driver of growth in the global tractor market. Features such as GPS guidance, auto-steering, telematics, and smart sensors are no longer limited to premium tractors but are now being offered across a wide range of horsepower segments.
- Farmers are increasingly investing in tractors with these technologies because they help improve productivity, reduce operating costs, and make farming more efficient.
- Precision farming technologies enable farmers to apply seeds, fertilizers, and crop protection products more accurately, reducing input waste while improving crop yields.
INDUSTRY RESTRAINTS
Supply Chain Dependence and Component Availability Constraints
- The global tractor industry depends on a complex supply chain involving components sourced from different countries. Modern tractors require advanced engines, transmissions, hydraulic systems, semiconductors, electronic control units, and high-quality steel.
- To reduce these risks, many manufacturers are expanding their supplier networks and increasing local production in major markets such as India and China. However, these changes require significant investment and time, making supply chain disruptions an ongoing challenge for the global tractor market
Shortage of Technical Workforce for Installation and Digital Integration
- Fluctuating fuel prices remain a major challenge for the global tractor market because most tractors currently operate on diesel engines. Diesel is one of the largest operating expenses for farmers, and sudden increases in fuel prices can significantly raise farming costs.
- Higher fuel expenses reduce farm profitability, making farmers more cautious about purchasing new tractors or replacing existing equipment. In many developing regions, limited fuel distribution infrastructure and regional price differences further increase operating costs and create additional uncertainty for farmers.
- The fuel price volatility continues to be an important factor restraining the growth of the global tractor market.
AGRICULTURE TRACTOR MARKET SEGMENTAION INSIGHTS
INSIGHTS BY HORSEPOWER
Based on the horsepower, the less than 50 HP segment accounted for the largest global agriculture tractor market share of around 59%. Its dominance is driven by the large number of smallholder farms across India, China, Southeast Asia, Sub-Saharan Africa, and parts of Southern and Eastern Europe, where compact and affordable tractors are best suited for farming activities.
Tractors below 50 HP are widely used for routine farming activities such as land preparation, sowing, spraying, cultivation, harvesting support, and transportation. Their compact size makes them easy to operate in small fields, orchards, vineyards, and horticultural farms where larger tractors are less practical.
In addition, these tractors consume less fuel, require lower maintenance, and have lower ownership costs, making them an economical choice for farmers with limited budgets.
INSIGHTS BY WHEEL DRIVE
The 2-wheel-drive tractor segment accounted for the largest global agricultural tractor market share and shows highest growth with the CAGR of 3.76% during the forecast period. The growth is supported by the widespread presence of small and medium-sized farms across Asia, Africa, and Latin America, where affordability and versatility are the primary purchasing considerations.
Most agricultural holdings globally are relatively small, and the majority of farming activities, including land preparation, sowing, spraying, and transportation, can be efficiently performed using 2WD tractors. Manufacturers continue to enhance 2WD tractors with more fuel-efficient engines, improved operator comfort, higher lifting capacity, and compatibility with modern implements.
The 4WD tractor segment also represent significant share in the global agricultural tractor market. Although its market share remains relatively small, the segment is expected to, driven by increasing demand for high-performance machinery in large-scale commercial farming. Demand for 4WD tractors is particularly strong in regions with large farm sizes and high mechanization levels. In Europe, countries such as Austria also rely on 4WD tractors for superior traction on steep and hilly terrain, even for lower-horsepower applications.
AGRICULTURE TRACTOR MARKET GEOGRAPHICAL ANALYSIS
The Asia-Pacific agricultural tractor market remained the largest in the world by unit sales during 2025 and is expected to continue leading global demand in 2026. The region's growth was primarily driven by India and China, both of which recorded strong tractor sales while several developed markets experienced weaker demand.
China also continued to expand its agricultural machinery market through government-led mechanization programs, encouraging the replacement of older equipment with modern, higher-horsepower tractors equipped with advanced technologies.
Government policies remain the key driver of tractor demand across the Asia-Pacific region. In India, the reduction of the Goods and Services Tax (GST) on tractors from 12% to 5%, expansion of Kisan Credit Card coverage to more than 70 million accounts, support under the Pradhan Mantri Fasal Bima Yojana, and increased government spending on agriculture and rural development have significantly improved farmers' purchasing ability.
The North American region holds the significant share of the global agriculture tractor market. The market experienced mixed performance during 2025, with the US recording weaker demand while Canada demonstrated relatively stronger market conditions. According to the Association of Equipment Manufacturers (AEM), U.S. tractor sales declined in most months of 2025 compared with the previous year, including double-digit decreases during January, March, April, November, and December.
High interest rates, elevated input costs, lower commodity prices, and uncertainty related to trade and tariff policies encouraged many farmers to postpone investments in new agricultural equipment.
The Canadian agricultural tractor market demonstrated stronger performance than the U.S. market throughout most of 2025, supported by stable farm conditions and continued equipment replacement demand. This growth was primarily supported by demand from large-scale grain and oilseed farms across Western Canada, where high-horsepower tractors are widely used for large-field farming operations.
Canada benefited from relatively stable farm income, a strong grain harvest across the Prairie provinces, and consistent replacement demand for agricultural machinery.
AGRICULTURE TRACTOR MARKET VENDOR LANDSCAPE
The global agriculture tractor market is highly concentrated, with the top players controlling most of the market. Domestic and global brands, on the other hand, are equally represented in the market.
The agriculture tractor market has established players in various segments. Vendors have improved their after-sales services, making customers loyal to the existing brands.
CNH Industrial, with its tractor brands Case IH, New Holland, and Steyr, has introduced autonomous technology in agriculture tractors. The company has already incorporated technologies, such as auto-steering and telematics, in its agriculture tractors. John Deere and AGCO worked to introduce the autonomous concept in their tractors.
In terms of advanced tractor technology, John Deere has equipped many models with GPS, location tracking, image sensors, and telematics to assist in field navigation. The company has also equipped its S700 model with features to autonomously adjust the harvesting equipment according to the state of crops. Vendors, such as ARGO and John Deere, provide direct financing to farmers to encourage them to buy tractors and other related agricultural machinery.
WHY SHOULD YOU BUY THIS REPORT?
This report is among the few in the market that offer outlook and opportunity analyses forecast in terms of the following:
- Market Size & Forecast Volume (units) 2022–2031
- Segmentation by Horsepower
- Segmentation by Drive Type
- Segmentation by Geography
- Production and trade values
- Major current and upcoming projects and investments
- Competitive intelligence about the economic scenario, advantages, industry dynamics, and market shares
- Innovative technologies
- Company profiles of major and other prominent vendors
- Market shares of major vendors
SNAPSHOT
The global agriculture tractor market size was valued at 2.09 million units in 2025 and is expected to reach 2.61 million units by 2031.
The following factors are likely to contribute to global agriculture tractor market growth:
- Accelerating Farm Mechanization in Emerging Economies
- Rapid Adoption of Precision Agriculture Technologies
- Expansion of Government Subsidies and Agricultural Financing
Base Year: 2025
Forecast Year: 2026-2031
The report considers the present scenario of the global agriculture tractor market and its market dynamics for 2026−2031. It covers a detailed overview of several market growth enablers, restraints, and trends. The study covers both the demand and supply sides of the industry. It also profiles and analyzes leading companies and several other prominent companies operating in the industry.
Key Company Profiles
- John Deere
- Business Overview
- Product Offerings
- Key Strategies
- Key Strengths
- Key Opportunities
- CNH Industrial
- AGCO Corporation
- Mahindra Tractors
- Kubota Corporation
Other Company Profiles
- CLASS
- Business Overview
- Product Offerings
- SAME DEUTZ-FAHR
- Yanmar
- Mitsubishi Agriculture Machinery
- TAFE
- Solis
- KIOTI
- ISEKI & Co Ltd
- LOVOL
- ARGO Tractors S.P.A
- Branson Tractor
- LS Tractor
- VST Tillers Tractors Ltd
- Zetor
- Hanomag
- Agrale S.A.
- Action Construction Equipment
- Foton Motor
- Antonio Carraro S.P.A
- JCB
Segmentation by Horsepower
- Less Than 50 HP
- 50-100 HP
- Above 100 HP
Segmentation by Drive Drive
- 2-Wheel Drive
- 4-Wheel Drive
Segmentation by Geography
- North America
- US
- Canada
- Europe
- Germany
- France
- UK
- Italy
- Spain
- Poland
- Austria
- Belgium
- APAC
- Apac
- China
- India
- Japan
- Thailand
- South Korea
- Australia
- Latin America
- Brazil
- Mexico
- Argentina
- Middle East & Africa
- Turkey
- South Africa
- Israel
AGRICULTURE TRACTOR MARKET FAQs
How big is the tractor market?
What is the growth rate of the global tractor market?
Which region holds the largest global tractor market share?
Who are the key companies in the global tractor market?
What is the growth rate of the global tractor market?
How big is the tractor market?
Who are the key companies in the global tractor market?
Which region holds the largest global tractor market share?
For more details, please reach us at [email protected]
For more details, please reach us at [email protected]
Select a license type that suits your business needs
Single User Licence
- Report accessible by one user only
- Free 10% or 3 days of customization
- Free post-sale service assistance
- Continuous support through email
5 User Licence
- Report accessible by 5 users within the organization
- Free 15% or 4.5 days of customization
- Continuous support through email and telephone
- Free analyst hour
- Free Upgrade: If an updated report published within 180 days of purchase, you will get the revised report free of charge
Corporate Licence
- Free Datasheet worth $1500
- Report accessible by the entire organization
- Free 20% or 6 days of customization
- Free post-sale service assistance
- Continuous support through email and telephone
- Direct access to lead analysts
- Free analyst hour
- Free Upgrade: If an updated report published within 180 days of purchase, you will get the revised report free of charge
Datasheet Licence
- Report accessible by 1 user only
- Free 15% or 32 hours of customization
- Free post-sale service assistance
- Direct access to lead analysts
Frequently Asked Questions
How big is the tractor market?
What is the growth rate of the global tractor market?
Which region holds the largest global tractor market share?
Who are the key companies in the global tractor market?
What is the growth rate of the global tractor market?
How big is the tractor market?
Who are the key companies in the global tractor market?
Which region holds the largest global tractor market share?