Membrane Bioreactor Market - Global Outlook & Forecast 2023-2028
THE GLOBAL MEMBRANE BIOREACTORS MARKET SIZE WAS VALUED AT USD 3.83 BILLION IN 2022 AND IS EXPECTED TO REACH USD 6.07 BILLION BY 2028, GROWING AT A CAGR OF 7.94% DURING THE FORECAST PERIOD.
THE GLOBAL MEMBRANE BIOREACTORS MARKET SIZE WAS VALUED AT USD 3.83 BILLION IN 2022 AND IS EXPECTED TO REACH USD 6.07 BILLION BY 2028, GROWING AT A CAGR OF 7.94% DURING THE FORECAST PERIOD.
The Membrane Bioreactors Market Size, Share, And Growth Forecast By:
- Membrane Type: Hollow Fiber, Flat Sheet, and Multi-Tubular
- System Configuration: Submerged and Side Stream
- Application: Municipal and Industrial
- System Type: Gravity-based and Pressure-driven
- Geography: North America, Europe, APAC, Latin America, and the Middle East & Africa
Industry Report, Regional Outlook, Growth Potential, Price Trends, Competitive Market Share, & Forecast 2023-2028
This report includes market data points, ranging from trend
analyses to market estimates & forecasts that you can customize
MEMBRANE BIOREACTORS MARKET REPORT SCOPE
| REPORT ATTRIBUTE | DETAILS |
|---|---|
| Market Size (2028) | USD 6.07 Billion |
| Market Size (2022) | USD 3.83 Billion |
| CAGR (2022-2028) | 7.94% |
| BASE YEAR | 2022 |
| FORECAST YEAR | 2023-2028 |
| SEGMENT TYPE | Membrane Type, System Configuration, Application, System Type, and Geography |
| GEOGRAPHIC ANALYSIS | North America, Europe, APAC, Latin America, and Middle East & Africa |
| LARGEST MARKET | APAC |
| KEY VENDORS | Evoqua Water Technologies, KUBOTA Corporation, Mitsubishi Chemical Aqua Solutions, and Veolia |
The global membrane bioreactors market was valued at USD 3.83 billion in 2022 and is expected to reach USD 6.07 billion by 2028, growing at a CAGR of 7.94% during the forecast period. The rising use of membrane bioreactors in municipal sectors majorly drives the market. The considerable benefits of using membrane bioreactors over conventional activated sludge treatment propel the demand for membrane bioreactors (MBRs). The increasing need for treated water and the efficient elimination of pathogens from wastewater treatment plants is boosting the demand for membrane bioreactors. Rising research and development activities to create advanced wastewater treatment methods that require lesser energy and incur reasonable prices are projected to lead the membrane bioreactors market during the forecast period.
MARKET TRENDS AND DRIVERS
Increasing MBR Installations Due to Growing Urbanization
Growing urbanization affects the environment by diminishing the availability of resources due to population growth. It causes health complications due to pollution and congested living conditions. Water quality in urban areas is also low due to factory waste. Therefore, clean water has become the key objective in urban areas, boosting the demand for membrane bioreactors. With increasing awareness of the harmful effects of contaminated water, the demand for membrane bioreactors in water treatment systems is expected to rise. Moreover, increasing urbanization has increased the global demand for energy and water. With increasing production from power plants, the emission of effluents into water bodies needs to be under control, increasing the installation of membrane bioreactors. Following this, the membrane bioreactors market is expected to witness significant growth in the coming years.
Limited Availability of Clean Water
The limited availability of clean water, one of the most crucial global challenges, presents a major threat to economic growth, ecosystem health, and water security. The challenge of supplying sufficient and safe drinking water is further complicated due to climate change and the pressure of industrialization and economic development. The industrial and public sectors consume significant amounts of freshwater while generating huge quantities of wastewater. If improperly treated, wastewater emission into the aquatic environment causes pollution, affecting public health and marine ecosystems. Due to the increasing demand for water, recycling, and wastewater recovery have become popular trends. Wastewater reuse reduces the volume and environmental threat of released wastewater and lowers the pressure on the ecosystem driven by freshwater withdrawal. A membrane bioreactor is a wastewater management technology that reduces wastewater emission and increases water usage efficiency, thus balancing preserving aquatic environments and exploiting freshwater resources.
INDUSTRY RESTRAINTS
High Capital & Operational Cost of MBRs
Utilizing membrane bioreactors (MBR) for new installations enables higher wastewater flow or improved treatment performance in a smaller space than a conventional design, i.e., a facility that utilizes sand filters and secondary clarifiers. Historically, membranes have been used for smaller-flow systems due to the soaring capital cost of the equipment and high operation and maintenance (O&M) costs. At present, however, there is an increased use in larger systems. Membrane bioreactor systems are appropriate for certain commercial and industrial applications. The high-quality effluent generated by membrane bioreactors makes it suitable for reuse and surface water emission applications necessitating extensive nutrients such as phosphorus removal. However, systems operating costs are also higher for membrane bioreactors due to the higher energy costs associated with sourcing to reduce membrane fouling, acting as a barrier to the growth of the membrane bioreactors market.
SEGMENTATION INSIGHTS
INSIGHTS BY MEMBRANE TYPE
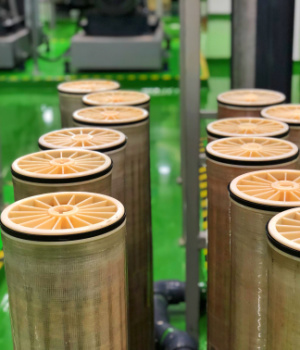
The global membrane bioreactors market by membrane type is segmented as hollow fiber, flat sheet, and multi-tubular. In 2022, the hollow fiber segment held the largest market share and dominated the membrane-type segment. Further, hollow fiber is estimated to be the most swiftly developing segment during the forecast period. Hollow fiber (HF) configurations comprise one of the three major configurations for membrane bioreactor technology. Hollow fiber membranes are almost always vertically oriented, with the aerators fitted to the frame or integrated with the membrane module. The fibers are generally offered with some slack to enable them to move laterally in the flow of air bubbles to airlift the sludge across the fiber bundle. Hollow fiber membranes are used almost entirely in immersed MBRs for municipal and industrial applications. They are mostly used in large installations based on their lower membrane aeration energy demand. Hollow-fiber membrane bioreactors (HFB) are used for culturing highly metabolic cells, especially hepatocytes, that require improved mass transfer compared to other cell types.
INSIGHTS BY SYSTEM CONFIGURATION
The submerged system configuration segment dominated the global membrane bioreactors market, accounting for a market share of over 57% in 2022. Submerged membrane bioreactors use a promising technology for water reclamation and wastewater treatment. It is a type of membrane bioreactor where two processes, separation and chemical reactions, occur simultaneously to produce a synergistic effect. This technology is employed in wastewater treatment for its lower sludge production and better effluent quality than conventional activated sludge processes.
INSIGHTS BY APPLICATION
The municipal application segment held the largest global membrane bioreactors market share in 2022. Globally, population growth has increased the demand for treated water. The scarcity of water resources has increased the demand for water recycling and water treatment services. Most of the wastewater treatment capacity offered by membrane bioreactors is for municipal wastewater treatment, as the overall flow of sewage is larger than that of industrial effluent. Municipal wastewater is usually treated to fulfill the statutory requirements for discharge into environmental waters.
INSIGHTS BY SYSTEM TYPE
The global membrane bioreactors market by system type is segmented into gravity-based and pressure-driven. In 2022, the gravity-based segment held the largest share of the market. Gravity-based systems are immersed and usually utilize flat sheet or hollow fiber membranes equipped in bioreactors or subsequent membrane tanks. Gravity-driven membrane (GDM) filtration is one of the most favorable membrane bioreactor configurations and runs at an ultra-low pressure by gravity, needing minimum energy. It can treat different types of water, including diluted wastewater and surface water, with varying contaminant levels. It also primarily reveals attractive potential in water reuse or seawater pre-treatment.
GEOGRAPHICAL ANALYSIS
The APAC region was the largest market for membrane bioreactors in 2022, accounting for over 39% of the global membrane bioreactors market share. Due to the increasing adoption of technically advanced products in the region, the region is expected to witness exponential growth during the forecast period. Rapid urbanization due to the migration of people from rural to urban areas is improving the standard of living in countries such as India, which offers various opportunities to expand the market in the country. Growing investments by the public sector in developing existing water and wastewater treatment systems with membrane bioreactor technology are also boosting market growth.
North America is accelerating due to rising investments in R&D for enhanced technologies and the region's increasing demand for water treatment systems. Growth in the pharmaceutical industry has fueled the demand for membrane bioreactors, thereby supporting the growth of the membrane bioreactors market in the region. Membrane bioreactors (MBRs) are increasingly used across Europe, offering communities cleaner rivers, groundwater, lakes, and coastal beaches. Several European water companies are commissioning and considering MBRs to treat municipal wastewater to meet stringent European water standards for safe water emission. On the other hand, Latin America and the Middle East are highly potential membrane bioreactors markets with enough opportunity for growth.
COMPETITIVE LANDSCAPE
The global membrane bioreactors (MBR) market is fairly fragmented, with many small and medium-sized manufacturers accounting for a major industry share. Major vendors are adopting innovative technologies to retain their position. Over the last few years, the industry has witnessed several acquisitions, strengthening companies' ability to offer multiple technologies and comprehensive solutions. However, the market is dominated by large players holding a significant industry share. Prominent players with a dominant presence in the global membrane bioreactors market include Evoqua Water Technologies, KUBOTA Corporation, Mitsubishi Chemical Aqua Solutions, and Veolia.
The growing presence of large companies is expected to continue to be a challenge for smaller companies. Further, these companies have strong financial benefits over smaller competitors in major business areas such as research, development, and marketing. Larger companies have developed capabilities to offer complete solutions under one umbrella. The companies are determined to widen their product offerings and strengthen their market position through acquisitions and partnerships. Customers are progressively looking for system suppliers who can offer complete solutions for diverse water requirements. For instance, engineering contracts that include both processed water and wastewater systems.
ABOUT THE REPORT
“Glance through the global membrane bioreactors market report of more than 200 pages comprising 100 tables and 75 exhibits to develop a deep understanding of the industry.”
The global membrane bioreactors market is provided for 2023 to 2028 and a base year of 2022. The industry is segmented by membrane type, system configuration, application, system type, and geography for the years considered. The report provides a holistic approach to the market to enable customers to analyze the market thoroughly.
“For further information & clarifications on the market, a discussion with the analyst can be arranged when feasible for the client.”
SNAPSHOT
The membrane bioreactors (MBR) market is expected to grow at a CAGR of approximately 7.94% from 2022 to 2028.
The following factors are likely to contribute to the growth of the global membrane bioreactors market during the forecast period:
- Growing Demand for High-Quality Effluents
- Increasing MBR Installations Due to Growing Urbanization
- Advancements in Membrane Bioreactor Technology
Base Year: 2022
Forecast Year: 2023-2028
The report considers the present scenario of the membrane bioreactors market and its market dynamics for 2023−2028. It covers a detailed overview of several market growth enablers, restraints, and trends. The study covers both the demand and supply sides of the market. It also profiles and analyzes leading companies and several other prominent companies operating in the market.
Key Vendors
- Evoqua Water Technologies
- Business Overview
- Product Offerings
- Key Strategies
- Key Strengths
- Key Opportunities
- KUBOTA Corporation
- Mitsubishi Chemical Aqua Solutions
- Veolia
Other Prominent Vendors
- Alfa Laval
- Business Overview
- Product Offerings
- Aquatech International
- Asahi Kasei
- BioprocessH2O
- CITIC Envirotech
- Culligan
- HUBER SE
- Koch Separation Solutions
- Newterra
- Pall Corporation
- Parkson Corporation
- Pentair
- Saur
- Siemens
- Toray Industries
- WEHRLE
- Ovivo
- Smith & Loveless
- Lenntech
- DuPont
- Hinada
- MANN+HUMMEL
- MARTIN Membrane Systems
- Sanitherm
- Sumitomo Electric Industries
- Triqua International
Segmentation by Membrane Type
- Hollow Fiber
- Flat Sheet
- Multi-Tubular
Segmentation by System Configuration
- Submerged
- Side Stream
Segmentation by Application
- Municipal
- Industrial
Segmentation by System Type
- Gravity-based
- Pressure-driven
Segmentation by Geography
- APAC
- China
- India
- Japan
- South Korea
- Australia
- North America
- US
- Canada
- Europe
- Germany
- UK
- France
- Italy
- Russia
- Latin America
- Brazil
- Mexico
- Middle East & Africa
- GCC
- South Africa
Frequently Asked Questions
How big is the membrane bioreactors market?
What is the growth rate of the global membrane bioreactors market?
Who are the key players in the global membrane bioreactors (MBR) market?
Which region holds the leading global membrane bioreactors market share?
What are the rising trends in the membrane bioreactors market?
EXHIBIT 1 SEGMENTATION OF GLOBAL MEMBRANE BIOREACTOR MARKET
EXHIBIT 2 MARKET SIZE CALCULATION APPROACH 2022
EXHIBIT 3 GLOBAL MEMBRANE BIOREACTORS MARKET 2023 & 2028 (REVENUE)
EXHIBIT 4 CAGR COMPARISON BY GEOGRAPHY 2022-2028
EXHIBIT 5 KEY PLAYERS IN GLOBAL MEMBRANE BIOREACTORS MARKET
EXHIBIT 6 KEY ADVANTAGES OF MEMBRANE BIOREACTORS
EXHIBIT 7 OPERATING PROCEDURE OF MEMBRANE BIOREACTOR
EXHIBIT 8 DENITRIFICATION (MLE PROCESS)
EXHIBIT 9 BIOLOGICAL P REMOVAL PROCESS
EXHIBIT 10 KEY PARAMETERS FOR ACTIVATED SLUDGE-BASED TECHNOLOGIES
EXHIBIT 11 MEMBRANE FILTRATION IN WASTEWATER TREATMENT
EXHIBIT 12 KEY DRIVERS FOR WASTEWATER TREATMENT EQUIPMENT
EXHIBIT 13 GOVERNMENT REGULATIONS IN DIFFERENT COUNTRIES
EXHIBIT 14 IMPACT OF GROWING DEMAND FOR HIGH-QUALITY EFFLUENTS
EXHIBIT 15 IMPACT OF INCREASING MBR INSTALLATIONS DUE TO GROWING URBANIZATION
EXHIBIT 16 GLOBAL URBAN POPULATION 2022
EXHIBIT 17 IMPACT OF ADVANCES IN MBR TECHNOLOGY
EXHIBIT 18 IMPACT OF LIMITED AVAILABILITY OF CLEAN WATER
EXHIBIT 19 IMPACT OF IMPLEMENTATION OF STRINGENT ENVIRONMENTAL REGULATIONS
EXHIBIT 20 IMPACT OF GROWING DEMAND FOR HOSPITAL WASTEWATER TREATMENT
EXHIBIT 21 IMPACT OF RISING CONCERN REGARDING WATERBORNE DISEASES
EXHIBIT 22 IMPACT OF HIGH CAPITAL & OPERATIONAL COST OF MBRS
EXHIBIT 23 IMPACT OF ADVANCED SYSTEMS REQUIRE SKILLED WORKFORCE
EXHIBIT 24 WATER & WASTEWATER TREATMENT PLANT OPERATORS BY AGE GROUP
EXHIBIT 25 IMPACT OF MEMBRANE FOULING
EXHIBIT 26 FACTORS AFFECTING MEMBRANE FOULING IN MBRS
EXHIBIT 27 INCREMENTAL GROWTH OF MEMBRANE BIOREACTORS MARKET BY GEOGRAPHY ($ MILLION)
EXHIBIT 28 GLOBAL MEMBRANE BIOREACTORS MARKET 2022–2028 ($ MILLION)
EXHIBIT 29 FIVE FORCES ANALYSIS 2022
EXHIBIT 30 INCREMENTAL GROWTH BY MEMBRANE TYPE 2022 & 2028
EXHIBIT 31 GLOBAL MEMBRANE BIOREACTORS MARKET BY MEMBRANE TYPE: OVERVIEW 2022-2028
EXHIBIT 32 GLOBAL HOLLOW FIBER MEMBRANE BIOREACTORS MARKET 2022–2028 ($ MILLION)
EXHIBIT 33 GLOBAL FLAT SHEET MEMBRANE BIOREACTORS MARKET 2022–2028 ($ MILLION)
EXHIBIT 34 GLOBAL MULTI-TUBULAR MEMBRANE BIOREACTORS MARKET 2022–2028 ($ MILLION)
EXHIBIT 35 INCREMENTAL GROWTH BY SYSTEM CONFIGURATION 2022 & 2028
EXHIBIT 36 GLOBAL MEMBRANE BIOREACTORS MARKET BY SYSTEM CONFIGURATION: OVERVIEW 2022-2028
EXHIBIT 37 GLOBAL SUBMERGED MEMBRANE BIOREACTORS MARKET 2022–2028 ($ MILLION)
EXHIBIT 38 GLOBAL SIDE STREAM MEMBRANE BIOREACTORS MARKET 2022–2028 ($ MILLION)
EXHIBIT 39 INCREMENTAL GROWTH BY APPLICATION 2022 & 2028
EXHIBIT 40 GLOBAL MEMBRANE BIOREACTORS MARKET BY APPLICATION: OVERVIEW 2022-2028
EXHIBIT 41 GLOBAL MUNICIPAL MEMBRANE BIOREACTORS MARKET 2022–2028 ($ MILLION)
EXHIBIT 42 GLOBAL INDUSTRIAL MEMBRANE BIOREACTORS MARKET 2022–2028 ($ MILLION)
EXHIBIT 43 INCREMENTAL GROWTH BY SYSTEM TYPE 2022 & 2028
EXHIBIT 44 GLOBAL MEMBRANE BIOREACTORS MARKET BY SYSTEM TYPE: OVERVIEW 2022-2028
EXHIBIT 45 GLOBAL GRAVITY-BASED MEMBRANE BIOREACTORS MARKET 2022–2028 ($ MILLION)
EXHIBIT 46 GLOBAL PRESSURE-DRIVEN MEMBRANE BIOREACTORS MARKET 2022–2028 ($ MILLION)
EXHIBIT 47 INCREMENTAL GROWTH BY GEOGRAPHY 2022 & 2028
EXHIBIT 48 GLOBAL MEMBRANE BIOREACTORS MARKET OVERVIEW
EXHIBIT 49 APAC MEMBRANE BIOREACTORS MARKET 2022–2028 ($ MILLION)
EXHIBIT 50 INCREMENTAL GROWTH IN APAC 2022 & 2028
EXHIBIT 51 MEMBRANE BIOREACTORS MARKET IN CHINA 2022–2028 ($ MILLION)
EXHIBIT 52 MEMBRANE BIOREACTORS MARKET IN INDIA 2022–2028 ($ MILLION)
EXHIBIT 53 MEMBRANE BIOREACTORS MARKET IN JAPAN 2022–2028 ($ MILLION)
EXHIBIT 54 MEMBRANE BIOREACTORS MARKET IN SOUTH KOREA 2022–2028 ($ MILLION)
EXHIBIT 55 MEMBRANE BIOREACTORS MARKET IN AUSTRALIA 2022–2028 ($ MILLION)
EXHIBIT 56 NORTH AMERICA MEMBRANE BIOREACTORS MARKET 2022–2028 ($ MILLION)
EXHIBIT 57 INCREMENTAL GROWTH IN NORTH AMERICA 2022 & 2028
EXHIBIT 58 MEMBRANE BIOREACTORS MARKET IN US 2022–2028 ($ MILLION)
EXHIBIT 59 MEMBRANE BIOREACTORS MARKET IN CANADA 2022–2028 ($ MILLION)
EXHIBIT 60 EUROPE MEMBRANE BIOREACTORS MARKET 2022–2028 ($ MILLION)
EXHIBIT 61 EUROPE WASTEWATER TREATMENT OVERVIEW
EXHIBIT 62 INCREMENTAL GROWTH IN EUROPE 2022 & 2028
EXHIBIT 63 MEMBRANE BIOREACTORS MARKET IN GERMANY 2022–2028 ($ MILLION)
EXHIBIT 64 MEMBRANE BIOREACTORS MARKET IN UK 2022–2028 ($ MILLION)
EXHIBIT 65 MEMBRANE BIOREACTORS MARKET IN FRANCE 2022–2028 ($ MILLION)
EXHIBIT 66 MEMBRANE BIOREACTORS MARKET IN ITALY 2022–2028 ($ MILLION)
EXHIBIT 67 MEMBRANE BIOREACTORS MARKET IN RUSSIA 2022–2028 ($ MILLION)
EXHIBIT 68 LATIN AMERICA MEMBRANE BIOREACTORS MARKET 2022–2028 ($ MILLION)
EXHIBIT 69 INCREMENTAL GROWTH IN LATIN AMERICA 2022 & 2028
EXHIBIT 70 MEMBRANE BIOREACTORS MARKET IN BRAZIL 2022–2028 ($ MILLION)
EXHIBIT 71 MEMBRANE BIOREACTORS MARKET IN MEXICO 2022–2028 ($ MILLION)
EXHIBIT 72 MIDDLE EAST & AFRICA MEMBRANE BIOREACTORS MARKET 2022–2028 ($ MILLION)
EXHIBIT 73 INCREMENTAL GROWTH IN MIDDLE EAST & AFRICA 2022 & 2028
EXHIBIT 74 MEMBRANE BIOREACTORS MARKET IN GCC 2022–2028 ($ MILLION)
EXHIBIT 75 MEMBRANE BIOREACTORS MARKET IN SOUTH KOREA 2022–2028 ($ MILLION)
LIST OF TABLES
TABLE 1 KEY CAVEATS
TABLE 2 CURRENCY CONVERSION 2015−2022
TABLE 3 GLOBAL MEMBRANE BIOREACTORS MARKET BY MEMBRANE TYPE 2022−2028 ($ MILLION)
TABLE 4 GLOBAL HOLLOW FIBER MEMBRANE BIOREACTORS MARKET BY GEOGRAPHY 2022−2028 ($ MILLION)
TABLE 5 FLAT SHEET MEMBRANE BIOREACTORS MARKET BY GEOGRAPHY 2022−2028 ($ MILLION)
TABLE 6 GLOBAL MULTI-TUBULAR MEMBRANE BIOREACTORS MARKET BY GEOGRAPHY 2022−2028 ($ MILLION)
TABLE 7 GLOBAL MEMBRANE BIOREACTORS MARKET BY SYSTEM CONFIGURATION 2022−2028 ($ MILLION)
TABLE 8 GLOBAL SUBMERGED MEMBRANE BIOREACTORS MARKET BY GEOGRAPHY 2022−2028 ($ MILLION)
TABLE 9 SIDE STREAM MEMBRANE BIOREACTORS MARKET BY GEOGRAPHY 2022−2028 ($ MILLION)
TABLE 10 GLOBAL MEMBRANE BIOREACTORS MARKET BY APPLICATION 2022−2028 ($ MILLION)
TABLE 11 GLOBAL MUNICIPAL MEMBRANE BIOREACTORS MARKET BY GEOGRAPHY 2022−2028 ($ MILLION)
TABLE 12 GLOBAL INDUSTRIAL MEMBRANE BIOREACTORS MARKET BY GEOGRAPHY 2022−2028 ($ MILLION)
TABLE 13 GLOBAL MEMBRANE BIOREACTORS MARKET BY SYSTEM TYPE 2022−2028 ($ MILLION)
TABLE 14 GLOBAL GRAVITY-BASED MEMBRANE BIOREACTORS MARKET BY GEOGRAPHY 2022−2028 ($ MILLION)
TABLE 15 GLOBAL PRESSURE-DRIVEN MEMBRANE BIOREACTORS MARKET BY GEOGRAPHY 2022−2028 ($ MILLION)
TABLE 16 GLOBAL MEMBRANE BIOREACTORS MARKET BY GEOGRAPHY 2022−2028 ($ MILLION)
TABLE 17 APAC MEMBRANE BIOREACTORS MARKET BY MEMBRANE TYPE 2022−2028 ($ MILLION)
TABLE 18 APAC MEMBRANE BIOREACTORS MARKET BY SYSTEM CONFIGURATION 2022−2028 ($ MILLION)
TABLE 19 APAC MEMBRANE BIOREACTORS MARKET BY APPLICATION 2022−2028 ($ MILLION)
TABLE 20 APAC MEMBRANE BIOREACTORS MARKET BY SYSTEM TYPE 2022−2028 ($ MILLION)
TABLE 21 NORTH AMERICA MEMBRANE BIOREACTORS MARKET BY MEMBRANE TYPE 2022−2028 ($ MILLION)
TABLE 22 NORTH AMERICA MEMBRANE BIOREACTORS MARKET BY SYSTEM CONFIGURATION 2022−2028 ($ MILLION)
TABLE 23 NORTH AMERICA MEMBRANE BIOREACTORS MARKET BY APPLICATION 2022−2028 ($ MILLION)
TABLE 24 NORTH AMERICA MEMBRANE BIOREACTORS MARKET BY SYSTEM TYPE 2022−2028 ($ MILLION)
TABLE 25 EUROPE MEMBRANE BIOREACTORS MARKET BY MEMBRANE TYPE 2022−2028 ($ MILLION)
TABLE 26 EUROPE MEMBRANE BIOREACTORS MARKET BY SYSTEM CONFIGURATION 2022−2028 ($ MILLION)
TABLE 27 EUROPE MEMBRANE BIOREACTORS MARKET BY APPLICATION 2022−2028 ($ MILLION)
TABLE 28 EUROPE MEMBRANE BIOREACTORS MARKET BY SYSTEM TYPE 2022−2028 ($ MILLION)
TABLE 29 LATIN AMERICA MEMBRANE BIOREACTORS MARKET BY MEMBRANE TYPE 2022−2028 ($ MILLION)
TABLE 30 LATIN AMERICA MEMBRANE BIOREACTORS MARKET BY SYSTEM CONFIGURATION 2022−2028 ($ MILLION)
TABLE 31 LATIN AMERICA MEMBRANE BIOREACTORS MARKET BY APPLICATION 2022−2028 ($ MILLION)
TABLE 32 LATIN AMERICA MEMBRANE BIOREACTORS MARKET BY SYSTEM TYPE 2022−2028 ($ MILLION)
TABLE 33 MIDDLE EAST & AFRICA MEMBRANE BIOREACTORS MARKET BY MEMBRANE TYPE 2022−2028 ($ MILLION)
TABLE 34 MIDDLE EAST & AFRICA MEMBRANE BIOREACTORS MARKET BY SYSTEM CONFIGURATION 2022−2028 ($ MILLION)
TABLE 35 MIDDLE EAST & AFRICA MEMBRANE BIOREACTORS MARKET BY APPLICATION 2022−2028 ($ MILLION)
TABLE 36 MIDDLE EAST & AFRICA MEMBRANE BIOREACTORS MARKET BY SYSTEM TYPE 2022−2028 ($ MILLION)
TABLE 37 EVOQUA WATER TECHNOLOGIES: MAJOR PRODUCT OFFERINGS
TABLE 38 KUBOTA CORPORATION: MAJOR PRODUCT OFFERINGS
TABLE 39 MITSUBISHI CHEMICAL AQUA SOLUTIONS: MAJOR PRODUCT OFFERINGS
TABLE 40 VEOLIA: MAJOR PRODUCT OFFERINGS
TABLE 41 ALFA LAVAL: MAJOR PRODUCT OFFERINGS
TABLE 42 AQUATECH INTERNATIONAL: MAJOR PRODUCT OFFERINGS
TABLE 43 ASAHI KASEI: MAJOR PRODUCT OFFERINGS
TABLE 44 BIOPROCESSH2O: MAJOR PRODUCT OFFERINGS
TABLE 45 CITIC ENVIROTECH: MAJOR PRODUCT OFFERINGS
TABLE 46 CULLIGAN: MAJOR PRODUCT OFFERINGS
TABLE 47 HUBER SE: MAJOR PRODUCT OFFERINGS
TABLE 48 KOCH SEPARATION SOLUTIONS: MAJOR PRODUCT OFFERINGS
TABLE 49 NEWTERRA: MAJOR PRODUCT OFFERINGS
TABLE 50 PALL CORPORATION: MAJOR PRODUCT OFFERINGS
TABLE 51 PARKSON CORPORATION: MAJOR PRODUCT OFFERINGS
TABLE 52 PENTAIR: MAJOR PRODUCT OFFERINGS
TABLE 53 SAUR: MAJOR PRODUCT OFFERINGS
TABLE 54 SIEMENS: MAJOR PRODUCT OFFERINGS
TABLE 55 TORAY INDUSTRIES: MAJOR PRODUCT OFFERINGS
TABLE 56 WEHRLE: MAJOR PRODUCT OFFERINGS
TABLE 57 OVIVO: MAJOR PRODUCT OFFERINGS
TABLE 58 SMITH & LOVELESS: MAJOR PRODUCT OFFERINGS
TABLE 59 LENNTECH: MAJOR PRODUCT OFFERINGS
TABLE 60 DUPONT: MAJOR PRODUCT OFFERINGS
TABLE 61 HINADA: MAJOR PRODUCT OFFERINGS
TABLE 62 MANN+HUMMEL: MAJOR PRODUCT OFFERINGS
TABLE 63 MARTIN MEMBRANE SYSTEMS: MAJOR PRODUCT OFFERINGS
TABLE 64 SANITHERM: MAJOR PRODUCT OFFERINGS
TABLE 65 SUMITOMO ELECTRIC INDUSTRIES: MAJOR PRODUCT OFFERINGS
TABLE 66 TRIQUA INTERNATIONAL: MAJOR PRODUCT OFFERINGS
TABLE 67 GLOBAL MEMBRANE BIOREACTORS MARKET BY GEOGRAPHY 2022−2028 ($ MILLION)
TABLE 68 APAC MEMBRANE BIOREACTORS MARKET BY MEMBRANE TYPE 2022−2028 ($ MILLION)
TABLE 69 APAC MEMBRANE BIOREACTORS MARKET BY SYSTEM CONFIGURATION 2022−2028 ($ MILLION)
TABLE 70 APAC MEMBRANE BIOREACTORS MARKET BY APPLICATION 2022−2028 ($ MILLION)
TABLE 71 APAC MEMBRANE BIOREACTORS MARKET BY SYSTEM TYPE 2022−2028 ($ MILLION)
TABLE 72 NORTH AMERICA MEMBRANE BIOREACTORS MARKET BY MEMBRANE TYPE 2022−2028 ($ MILLION)
TABLE 73 NORTH AMERICA MEMBRANE BIOREACTORS MARKET BY SYSTEM CONFIGURATION 2022−2028 ($ MILLION)
TABLE 74 NORTH AMERICA MEMBRANE BIOREACTORS MARKET BY APPLICATION 2022−2028 ($ MILLION)
TABLE 75 NORTH AMERICA MEMBRANE BIOREACTORS MARKET BY SYSTEM TYPE 2022−2028 ($ MILLION)
TABLE 76 EUROPE MEMBRANE BIOREACTORS MARKET BY MEMBRANE TYPE 2022−2028 ($ MILLION)
TABLE 77 EUROPE MEMBRANE BIOREACTORS MARKET BY SYSTEM CONFIGURATION 2022−2028 ($ MILLION)
TABLE 78 EUROPE MEMBRANE BIOREACTORS MARKET BY APPLICATION 2022−2028 ($ MILLION)
TABLE 79 EUROPE MEMBRANE BIOREACTORS MARKET BY SYSTEM TYPE 2022−2028 ($ MILLION)
TABLE 80 LATIN AMERICA MEMBRANE BIOREACTORS MARKET BY MEMBRANE TYPE 2022−2028 ($ MILLION)
TABLE 81 LATIN AMERICA MEMBRANE BIOREACTORS MARKET BY SYSTEM CONFIGURATION 2022−2028 ($ MILLION)
TABLE 82 LATIN AMERICA MEMBRANE BIOREACTORS MARKET BY APPLICATION 2022−2028 ($ MILLION)
TABLE 83 LATIN AMERICA MEMBRANE BIOREACTORS MARKET BY SYSTEM TYPE 2022−2028 ($ MILLION)
TABLE 84 MIDDLE EAST & AFRICA MEMBRANE BIOREACTORS MARKET BY MEMBRANE TYPE 2022−2028 ($ MILLION)
TABLE 85 MIDDLE EAST & AFRICA MEMBRANE BIOREACTORS MARKET BY SYSTEM CONFIGURATION 2022−2028 ($ MILLION)
TABLE 86 MIDDLE EAST & AFRICA MEMBRANE BIOREACTORS MARKET BY APPLICATION 2022−2028 ($ MILLION)
TABLE 87 MIDDLE EAST & AFRICA MEMBRANE BIOREACTORS MARKET BY SYSTEM TYPE 2022−2028 ($ MILLION)
TABLE 88 GLOBAL MEMBRANE BIOREACTORS MARKET BY MEMBRANE TYPE 2022−2028 ($ MILLION)
TABLE 89 HOLLOW FIBER MEMBRANE BIOREACTORS MARKET BY GEOGRAPHY 2022−2028 ($ MILLION)
TABLE 90 FLAT SHEET MEMBRANE BIOREACTORS MARKET BY GEOGRAPHY 2022−2028 ($ MILLION)
TABLE 91 MULTI-TUBULAR MEMBRANE BIOREACTORS MARKET BY GEOGRAPHY 2022−2028 ($ MILLION)
TABLE 92 GLOBAL MEMBRANE BIOREACTORS MARKET BY SYSTEM CONFIGURATION 2022−2028 ($ MILLION)
TABLE 93 SUBMERGED MEMBRANE BIOREACTORS MARKET BY GEOGRAPHY 2022−2028 ($ MILLION)
TABLE 94 SIDE STREAM MEMBRANE BIOREACTORS MARKET BY GEOGRAPHY 2022−2028 ($ MILLION)
TABLE 95 GLOBAL MEMBRANE BIOREACTORS MARKET BY APPLICATION 2022−2028 ($ MILLION)
TABLE 96 MUNICIPAL MEMBRANE BIOREACTORS MARKET BY GEOGRAPHY 2022−2028 ($ MILLION)
TABLE 97 INDUSTRIAL MEMBRANE BIOREACTORS MARKET BY GEOGRAPHY 2022−2028 ($ MILLION)
TABLE 98 GLOBAL MEMBRANE BIOREACTORS MARKET BY SYSTEM TYPE 2022−2028 ($ MILLION)
TABLE 99 GRAVITY-BASED MEMBRANE BIOREACTORS MARKET BY GEOGRAPHY 2022−2028 ($ MILLION)
TABLE 100 PRESSURE-DRIVEN MEMBRANE BIOREACTORS MARKET BY GEOGRAPHY 2022−2028 ($ MILLION)
1 RESEARCH METHODOLOGY
2 RESEARCH OBJECTIVES
3 RESEARCH PROCESS
4 SCOPE & COVERAGE
4.1 MARKET DEFINITION
4.1.1 INCLUSIONS
4.1.2 EXCLUSIONS
4.1.3 MARKET ESTIMATION CAVEATS
4.2 BASE YEAR
4.3 SCOPE OF THE STUDY
4.4 MARKET SEGMENTS
4.4.1 MARKET SEGMENTATION BY MEMBRANE TYPE
4.4.2 MARKET SEGMENTATION BY SYSTEM CONFIGURATION
4.4.3 MARKET SEGMENTATION BY APPLICATION
4.4.4 MARKET SEGMENTATION BY TYPE OF SYSTEM
4.4.5 MARKET SEGMENTATION BY GEOGRAPHY
5 REPORT ASSUMPTIONS & CAVEATS
5.1 KEY CAVEATS
5.2 CURRENCY CONVERSION
5.3 MARKET DERIVATION
6 MARKET AT A GLANCE
7 PREMIUM INSIGHTS
7.1 MARKET OVERVIEW
7.2 MARKET DYNAMICS: KEY TRENDS, DRIVERS, AND RESTRAINTS
7.2.1 MARKET TRENDS
7.2.2 MARKET ENABLERS
7.2.3 MARKET RESTRAINTS
7.3 SEGMENT ANALYSIS
7.4 GEOGRAPHICAL ANALYSIS
7.5 COMPETITIVE LANDSCAPE
7.6 ABOUT THE REPORT
8 INTRODUCTION
8.1 OVERVIEW
8.1.1 BENEFITS OF MBR OVER CONVENTIONAL ACTIVATED SLUDGE WASTEWATER TREATMENT
8.2 COMPONENTS OF MEMBRANE BIOREACTORS
8.3 MBR OPERATION AND MAINTENANCE
8.3.1 NUTRIENT REMOVAL
8.3.2 BIOLOGICAL PROCESS PARAMETERS IN MBRS
8.4 MBR COSTS OVERVIEW
8.5 MEMBRANES FOR WASTEWATER TREATMENT
8.5.1 TRENDS IN WASTEWATER TREATMENT INDUSTRY
8.6 GOVERNMENT REGULATIONS
9 MARKET OPPORTUNITIES & TRENDS
9.1 GROWING DEMAND FOR HIGH-QUALITY EFFLUENTS
9.2 INCREASING MBR INSTALLATIONS DUE TO GROWING URBANIZATION
9.3 ADVANCES IN MBR TECHNOLOGY
10 MARKET GROWTH ENABLERS
10.1 LIMITED AVAILABILITY OF CLEAN WATER
10.2 IMPLEMENTATION OF STRINGENT ENVIRONMENTAL REGULATIONS
10.3 GROWING DEMAND FOR HOSPITAL WASTEWATER TREATMENT
10.4 RISING CONCERN REGARDING WATERBORNE DISEASES
11 MARKET RESTRAINTS
11.1 HIGH CAPITAL & OPERATIONAL COST OF MBRS
11.2 ADVANCED SYSTEMS REQUIRE SKILLED WORKFORCE
11.3 MEMBRANE FOULING
12 MARKET LANDSCAPE
12.1 MARKET SIZE & FORECAST
12.2 FIVE FORCES ANALYSIS
12.2.1 THREAT OF NEW ENTRANTS
12.2.2 BARGAINING POWER OF SUPPLIERS
12.2.3 BARGAINING POWER OF BUYERS
12.2.4 THREAT OF SUBSTITUTES
12.2.5 COMPETITIVE RIVALRY
13 MEMBRANE TYPE
13.1 MARKET SNAPSHOT & GROWTH ENGINE
13.2 MARKET OVERVIEW
13.3 HOLLOW FIBER
13.3.1 MARKET SIZE & FORECAST
13.3.2 MARKET BY GEOGRAPHY
13.4 FLAT SHEET
13.4.1 MARKET SIZE & FORECAST
13.4.2 MARKET BY GEOGRAPHY
13.5 MULTI-TUBULAR
13.5.1 MARKET SIZE & FORECAST
13.5.2 MARKET BY GEOGRAPHY
14 SYSTEM CONFIGURATION
14.1 MARKET SNAPSHOT & GROWTH ENGINE
14.2 MARKET OVERVIEW
14.3 SUBMERGED
14.3.1 MARKET SIZE & FORECAST
14.3.2 MARKET BY GEOGRAPHY
14.4 SIDE STREAM
14.4.1 MARKET SIZE & FORECAST
14.4.2 MARKET BY GEOGRAPHY
15 APPLICATION
15.1 MARKET SNAPSHOT & GROWTH ENGINE
15.2 MARKET OVERVIEW
15.3 MUNICIPAL
15.3.1 MARKET SIZE & FORECAST
15.3.2 MARKET BY GEOGRAPHY
15.4 INDUSTRIAL
15.4.1 MARKET SIZE & FORECAST
15.4.2 MARKET BY GEOGRAPHY
16 SYSTEM TYPE
16.1 MARKET SNAPSHOT & GROWTH ENGINE
16.2 MARKET OVERVIEW
16.3 GRAVITY BASED
16.3.1 MARKET SIZE & FORECAST
16.3.2 MARKET BY GEOGRAPHY
16.4 PRESSURE DRIVEN
16.4.1 MARKET SIZE & FORECAST
16.4.2 MARKET BY GEOGRAPHY
17 GEOGRAPHY
17.1 MARKET SNAPSHOT & GROWTH ENGINE
17.2 GEOGRAPHIC OVERVIEW
18 APAC
18.1 MARKET SIZE & FORECAST
18.2 MEMBRANE TYPE
18.2.1 MARKET SIZE & FORECAST
18.3 SYSTEM CONFIGURATION
18.3.1 MARKET SIZE & FORECAST
18.4 APPLICATION
18.4.1 MARKET SIZE & FORECAST
18.5 SYSTEM TYPE
18.5.1 MARKET SIZE & FORECAST
18.6 KEY COUNTRIES
18.6.1 CHINA: MARKET SIZE & FORECAST
18.6.2 INDIA: MARKET SIZE & FORECAST
18.6.3 JAPAN: MARKET SIZE & FORECAST
18.6.4 SOUTH KOREA: MARKET SIZE & FORECAST
18.6.5 AUSTRALIA: MARKET SIZE & FORECAST
19 NORTH AMERICA
19.1 MARKET SIZE & FORECAST
19.2 MEMBRANE TYPE
19.2.1 MARKET SIZE & FORECAST
19.3 SYSTEM CONFIGURATION
19.3.1 MARKET SIZE & FORECAST
19.4 APPLICATION
19.4.1 MARKET SIZE & FORECAST
19.5 SYSTEM TYPE
19.5.1 MARKET SIZE & FORECAST
19.6 KEY COUNTRIES
19.6.1 US: MARKET SIZE & FORECAST
19.6.2 CANADA: MARKET SIZE & FORECAST
20 EUROPE
20.1 MARKET SIZE & FORECAST
20.2 MEMBRANE TYPE
20.2.1 MARKET SIZE & FORECAST
20.3 SYSTEM CONFIGURATION
20.3.1 MARKET SIZE & FORECAST
20.4 APPLICATION
20.4.1 MARKET SIZE & FORECAST
20.5 SYSTEM TYPE
20.5.1 MARKET SIZE & FORECAST
20.6 KEY COUNTRIES
20.6.1 GERMANY: MARKET SIZE & FORECAST
20.6.2 UK: MARKET SIZE & FORECAST
20.6.3 FRANCE: MARKET SIZE & FORECAST
20.6.4 ITALY: MARKET SIZE & FORECAST
20.6.5 RUSSIA: MARKET SIZE & FORECAST
21 LATIN AMERICA
21.1 MARKET SIZE & FORECAST
21.2 MEMBRANE TYPE
21.2.1 MARKET SIZE & FORECAST
21.3 SYSTEM CONFIGURATION
21.3.1 MARKET SIZE & FORECAST
21.4 APPLICATION
21.4.1 MARKET SIZE & FORECAST
21.5 SYSTEM TYPE
21.5.1 MARKET SIZE & FORECAST
21.6 KEY COUNTRIES
21.6.1 BRAZIL: MARKET SIZE & FORECAST
21.6.2 MEXICO: MARKET SIZE & FORECAST
22 MIDDLE EAST & AFRICA
22.1 MARKET SIZE & FORECAST
22.2 MEMBRANE TYPE
22.2.1 MARKET SIZE & FORECAST
22.3 SYSTEM CONFIGURATION
22.3.1 MARKET SIZE & FORECAST
22.4 APPLICATION
22.4.1 MARKET SIZE & FORECAST
22.5 SYSTEM TYPE
22.5.1 MARKET SIZE & FORECAST
22.6 KEY COUNTRIES
22.6.1 GCC: MARKET SIZE & FORECAST
22.6.2 SOUTH AFRICA: MARKET SIZE & FORECAST
23 COMPETITIVE LANDSCAPE
23.1 COMPETITION OVERVIEW
24 KEY COMPANY PROFILES
24.1 EVOQUA WATER TECHNOLOGIES
24.1.1 BUSINESS OVERVIEW
24.1.2 PRODUCT OFFERINGS
24.1.3 KEY STRATEGIES
24.1.4 KEY STRENGTHS
24.1.5 KEY OPPORTUNITIES
24.2 KUBOTA CORPORATION
24.2.1 BUSINESS OVERVIEW
24.2.2 PRODUCT OFFERINGS
24.2.3 KEY STRATEGIES
24.2.4 KEY STRENGTHS
24.2.5 KEY OPPORTUNITIES
24.3 MITSUBISHI CHEMICAL AQUA SOLUTIONS
24.3.1 BUSINESS OVERVIEW
24.3.2 PRODUCT OFFERINGS
24.3.3 KEY STRATEGIES
24.3.4 KEY STRENGTHS
24.3.5 KEY OPPORTUNITIES
24.4 VEOLIA
24.4.1 BUSINESS OVERVIEW
24.4.2 PRODUCT OFFERINGS
24.4.3 KEY STRATEGIES
24.4.4 KEY STRENGTHS
24.4.5 KEY OPPORTUNITIES
25 OTHER PROMINENT VENDORS
25.1 ALFA LAVAL
25.1.1 BUSINESS OVERVIEW
25.1.2 PRODUCT OFFERINGS
25.2 AQUATECH INTERNATIONAL
25.2.1 BUSINESS OVERVIEW
25.2.2 PRODUCT OFFERINGS
25.3 ASAHI KASEI
25.3.1 BUSINESS OVERVIEW
25.3.2 PRODUCT OFFERINGS
25.4 BIOPROCESSH2O
25.4.1 BUSINESS OVERVIEW
25.4.2 PRODUCT OFFERINGS
25.5 CITIC ENVIROTECH
25.5.1 BUSINESS OVERVIEW
25.5.2 PRODUCT OFFERINGS
25.6 CULLIGAN
25.6.1 BUSINESS OVERVIEW
25.6.2 PRODUCT OFFERINGS
25.7 HUBER SE
25.7.1 BUSINESS OVERVIEW
25.7.2 PRODUCT OFFERINGS
25.8 KOCH SEPARATION SOLUTIONS
25.8.1 BUSINESS OVERVIEW
25.8.2 PRODUCT OFFERINGS
25.9 NEWTERRA
25.9.1 BUSINESS OVERVIEW
25.9.2 PRODUCT OFFERINGS
25.10 PALL CORPORATION
25.10.1 BUSINESS OVERVIEW
25.10.2 PRODUCT OFFERINGS
25.11 PARKSON CORPORATION
25.11.1 BUSINESS OVERVIEW
25.11.2 PRODUCT OFFERINGS
25.12 PENTAIR
25.12.1 BUSINESS OVERVIEW
25.12.2 PRODUCT OFFERINGS
25.13 SAUR
25.13.1 BUSINESS OVERVIEW
25.13.2 PRODUCT OFFERINGS
25.14 SIEMENS
25.14.1 BUSINESS OVERVIEW
25.14.2 PRODUCT OFFERINGS
25.15 TORAY INDUSTRIES
25.15.1 BUSINESS OVERVIEW
25.15.2 PRODUCT OFFERINGS
25.16 WEHRLE
25.16.1 BUSINESS OVERVIEW
25.16.2 PRODUCT OFFERINGS
25.17 OVIVO
25.17.1 BUSINESS OVERVIEW
25.17.2 PRODUCT OFFERINGS
25.18 SMITH & LOVELESS
25.18.1 BUSINESS OVERVIEW
25.18.2 PRODUCT OFFERINGS
25.19 LENNTECH
25.19.1 BUSINESS OVERVIEW
25.19.2 PRODUCT OFFERINGS
25.20 DUPONT
25.20.1 BUSINESS OVERVIEW
25.20.2 PRODUCT OFFERINGS
25.21 HINADA
25.21.1 BUSINESS OVERVIEW
25.21.2 PRODUCT OFFERINGS
25.22 MANN+HUMMEL
25.22.1 BUSINESS OVERVIEW
25.22.2 PRODUCT OFFERINGS
25.23 MARTIN MEMBRANE SYSTEMS
25.23.1 BUSINESS OVERVIEW
25.23.2 PRODUCT OFFERINGS
25.24 SANITHERM
25.24.1 BUSINESS OVERVIEW
25.24.2 PRODUCT OFFERINGS
25.25 SUMITOMO ELECTRIC INDUSTRIES
25.25.1 BUSINESS OVERVIEW
25.25.2 PRODUCT OFFERINGS
25.26 TRIQUA INTERNATIONAL
25.26.1 BUSINESS OVERVIEW
25.26.2 PRODUCT OFFERINGS
26 REPORT SUMMARY
26.1 KEY TAKEAWAYS
26.2 STRATEGIC RECOMMENDATIONS
27 QUANTITATIVE SUMMARY
27.1 MARKET BY GEOGRAPHY
27.2 APAC
27.2.1 MEMBRANE TYPE
27.2.2 SYSTEM CONFIGURATION
27.2.3 APPLICATION
27.2.4 SYSTEM TYPE
27.3 NORTH AMERICA
27.3.1 MEMBRANE TYPE
27.3.2 SYSTEM CONFIGURATION
27.3.3 APPLICATION
27.3.4 SYSTEM TYPE
27.4 EUROPE
27.4.1 MEMBRANE TYPE
27.4.2 SYSTEM CONFIGURATION
27.4.3 APPLICATION
27.4.4 SYSTEM TYPE
27.5 LATIN AMERICA
27.5.1 MEMBRANE TYPE
27.5.2 SYSTEM CONFIGURATION
27.5.3 APPLICATION
27.5.4 SYSTEM TYPE
27.6 MIDDLE EAST & AFRICA
27.6.1 MEMBRANE TYPE
27.6.2 SYSTEM CONFIGURATION
27.6.3 APPLICATION
27.6.4 SYSTEM TYPE
27.7 MEMBRANE TYPE
27.7.1 HOLLOW FIBER
27.7.2 FLAT SHEET
27.7.3 MULTI-TUBULAR
27.8 SYSTEM CONFIGURATION
27.8.1 SUBMERGED
27.8.2 SIDE STREAM
27.9 APPLICATION
27.9.1 MUNICIPAL
27.9.2 INDUSTRIAL
27.10 SYSTEM TYPE
27.10.1 GRAVITY-BASED
27.10.2 PRESSURE-DRIVEN
28 APPENDIX
28.1 ABBREVIATIONS
Select a license type that suits your business needs
Single User Licence
- Report accessible by one user only
- Free 10% or 3 days of customization
- Free post-sale service assistance
- Continuous support through email
5 User Licence
- Report accessible by 5 users within the organization
- Free 15% or 4.5 days of customization
- Continuous support through email and telephone
- Free analyst hour
- Free Upgrade: If an updated report published within 180 days of purchase, you will get the revised report free of charge
Corporate Licence
- Free Datasheet worth $1500
- Report accessible by the entire organization
- Free 20% or 6 days of customization
- Free post-sale service assistance
- Continuous support through email and telephone
- Direct access to lead analysts
- Free analyst hour
- Free Upgrade: If an updated report published within 180 days of purchase, you will get the revised report free of charge
Datasheet Licence
- Report accessible by 1 user only
- Free 15% or 32 hours of customization
- Free post-sale service assistance
- Direct access to lead analysts
Frequently Asked Questions
How big is the membrane bioreactors market?
What is the growth rate of the global membrane bioreactors market?
Who are the key players in the global membrane bioreactors (MBR) market?
Which region holds the leading global membrane bioreactors market share?
What are the rising trends in the membrane bioreactors market?
Other RELATED Reports

 Membrane and Component Market - Global Outlook & Forecast 2021-2026-1632991965.png)
Reverse Osmosis (RO) Membrane and Component Market - Global Outlook & Forecast 2021-2026
Published : November 2021