Global Precision Parts Market Research Report 2026-2031
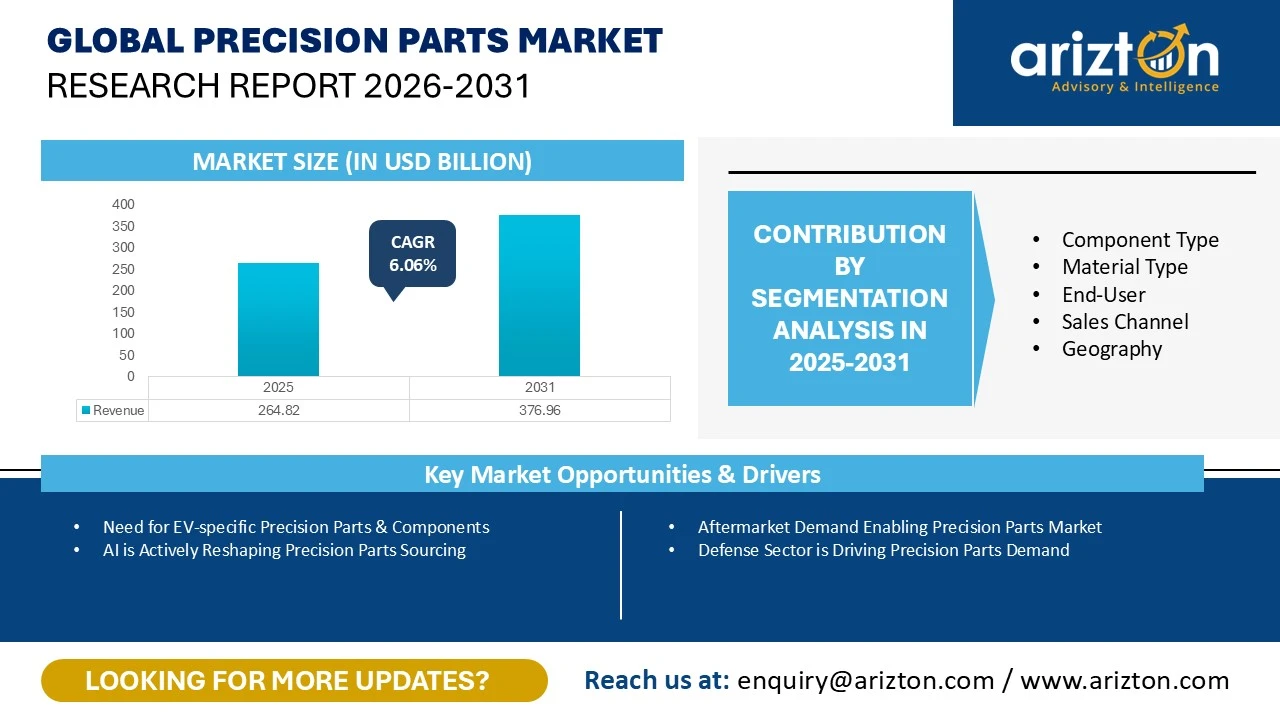
THE GLOBAL PRECISION PARTS MARKET SIZE WAS VALUED AT USD 264.82 BILLION IN 2025 AND IS EXPECTED TO REACH USD 376.96 BILLION BY 2031, GROWING AT A CAGR OF 6.06% DURING 2025–2031.

Global Precision Parts Market Growth Insights – Driven by Rising Aerospace & Defense Manufacturing Investments, Advancements in Precision Manufacturing Technologies, Expanding Aftermarket Demand, and Government Initiatives Supporting High-Precision Industrial Production (2026–2031)
To Be Published : July 2026
Last Updated : July 2026
format: PDF
edition : Fourth Edition
241 pages
6 tables
49 charts
5 region
23 countries
60 company
5 segments
Purchase Options
Global Precision Parts Market Research Report 2026-2031
THE GLOBAL PRECISION PARTS MARKET SIZE WAS VALUED AT USD 264.82 BILLION IN 2025 AND IS EXPECTED TO REACH USD 376.96 BILLION BY 2031, GROWING AT A CAGR OF 6.06% DURING 2025–2031.
The Precision Parts Market Size, Share & Trends Analysis Report By
- Component Type: Machined Component, Forged & Stamped Component, Cast Component, Other Precision Component
- Material Type: Metal & Alloys, Plastics & Composites, Others
- End-User: Automotive & Transportation, Aerospace & Defense, Industrial Machinery, Electronics & Semiconductor Equipment, Energy & Power, Medical Devices / Healthcare, Others
- Sales Channel: Direct Sales, Indirect Sales
- Geography: APAC, North America, Europe, Latin America, and Middle East & Africa
Industry Analysis Report, Regional Outlook, Growth Potential, Price Trends, Competitive Market Share & Forecast 2026–2031.
This report includes market data points, ranging from trend
analyses to market estimates & forecasts that you can customize
PRECISION PARTS MARKET REPORT SCOPE
| REPORT ATTRIBUTE | DETAILS |
|---|---|
| MARKET SIZE (2031) | USD 376.96 Billion |
| MARKET SIZE (2025) | USD 264.82 Billion |
| CAGR (2025-2031) | 6.06% |
| HISTORIC YEAR | 2022- 2024 |
| BASE YEAR | 2025 |
| FORECAST YEAR | 2026-2031 |
| SEGMENTS BY | Component Type, Material Type, End-User, Sales Channel, and Geography |
| GEOGRAPHIC ANALYSIS | APAC, North America, Europe, Latin America, and Middle East & Africa |
| KEY PLAYERS | Barnes Aerospace, Impro Precision Industries Limited, Linamar International, Martinrea International Inc., NN Inc., Bharat Forge Limited, Regal Rexnord, Suprajit Group, AccuRounds, and Aequs |
PRECISION PARTS MARKET SIZE & SHARE
The global precision parts market size was valued at USD 264.82 billion in 2025 and is expected to reach USD 376.96 billion by 2031, growing at a CAGR of 6.06% during the forecast period. The market is experiencing growth, driven by several factors, including rising investments in aerospace parts manufacturing, increasing demand for precision parts from the defense sector, advancements in precision manufacturing technologies, growing aftermarket demand for precision parts, and government initiatives supporting the demand for precision parts.
Recent Developments in the Global Precision Parts Market
- On October 22, 2025, Barnes completed its separation into two independent companies: Barnes Aerospace and The Industrial Solutions Group. The move enables Barnes Aerospace to capitalize on tailwinds in the aerospace industry and accelerate value creation, while the Industrial Solutions Group focuses on delivering highly engineered solutions for complex products globally.
- On August 13, 2025, GE Aerospace awarded a six-year contract to Barnes Aerospace for the manufacturing of components for the T700/CT7 engine family at its Newton Abbot facility in the United Kingdom. The partnership supports the UK Government’s Strategic Defense Review objectives for resilient supply chains and a stronger industrial base.
- On November 14, 2025, Linamar Corporation completed the acquisition of select Aludyne North America assets for $300 million, expanding its capabilities in aluminum casting, precision machining, and structural component design within its Mobility Segment.
- On March 11, 2026, Bharat Forge inaugurated an OEM-approved Landing Gear Components Machining Facility in Pune in collaboration with Liebherr-Aerospace & Transportation SAS, enhancing its aerospace manufacturing capabilities and supporting India's integration into global aerospace supply chains.
PRECISION PARTS MARKET TRENDS
Need for EV-specific Precision Parts & Components
The growing adoption of electric vehicles is reshaping precision component demand across the automotive industry as OEMs expand electrified vehicle production alongside conventional vehicle manufacturing. Supported by stricter emission regulations, government incentives, investments in charging infrastructure, and local battery manufacturing, automotive manufacturers are redesigning vehicle platforms around electric drivetrains. This is increasing demand for precision components such as battery enclosures, motor housings, thermal management systems, lightweight structural components, power electronics housings, and electrified driveline parts, while maintaining production of traditional automotive components. For instance, in January 2025, Linamar announced a $1.1 billion investment in Ontario to expand EV component manufacturing, including powertrain, e-axle, battery, and hydrogen fuel cell technologies, reflecting how manufacturers are expanding capabilities to support evolving automotive requirements and long-term electrification strategies.
AI is Actively Reshaping Precision Parts Sourcing
Artificial intelligence is transforming the precision parts industry by making sourcing, production planning, and supplier coordination faster and more efficient. AI-powered digital manufacturing platforms are replacing manual quotation processes with instant pricing, automated design-for-manufacturability analysis, supplier matching, and integrated production management, enabling manufacturers to reduce lead times and improve production responsiveness. For instance, on February 17, 2026, Protolabs introduced ProDesk, an AI-enabled digital manufacturing platform that provides real-time quoting and AI-driven design-for-manufacturability analysis for CNC machining, injection molding, and 3D printing applications, reflecting how established manufacturers are also embedding AI into their workflows alongside digital manufacturing platforms. This indeed is raising buyer expectations for faster procurement, greater pricing transparency, and quicker manufacturability feedback when sourcing precision components.
GLOBAL PRECISION PARTS MARKET DRIVERS
Aftermarket Demand Enabling Precision Parts Market
The aftermarket and maintenance ecosystem is becoming a key long-term enabler for the precision parts industry by creating recurring demand for high-precision replacement components across aerospace, automotive, industrial machinery, and heavy equipment. Even when new equipment production slows, equipment already in operation continues to require inspections, repairs, overhauls, and component replacements to ensure reliability, safety, and operational uptime. This is encouraging manufacturers to strengthen spare parts production and expand service capabilities to support equipment throughout its lifecycle. For instance, on March 9, 2026, SKF signed a definitive agreement to acquire G Tech Instruments Inc. to strengthen its digitally enabled reliability and condition monitoring solutions. The acquisition supports the company’s strategy of expanding higher-value aftermarket and predictive maintenance capabilities across industrial customer segments, reflecting the growing focus on long-term aftermarket support across the industry.
Defense Sector is Driving Precision Parts Demand
Rising defense spending, military modernization programs, and growing geopolitical tensions are strengthening demand for high-precision components used in advanced defense platforms. Combat aircraft, missile systems, naval vessels, armored vehicles, and surveillance equipment require complex precision-engineered parts manufactured to stringent quality and performance standards. At the same time, governments are expanding domestic defense manufacturing and prioritizing localized supply chains to improve production security and reduce external dependencies. For instance, Bharat Forge, a global heavy-engineering powerhouse, is expanding its defense manufacturing presence through its subsidiary Agneyastra Energetics, where the company began construction on a 1,000-acre, INR $170 million defense manufacturing facility in Andhra Pradesh, highlighting how defense investments are creating long-term opportunities for precision parts manufacturers.
INDUSTRY RESTRAINTS
Business Disruptions Driven by Cybersecurity Threats
The increasing digitalization of manufacturing is making cybersecurity a critical challenge for the precision parts industry. As manufacturers adopt connected production technologies and cloud-based systems, the risk of cyberattacks disrupting operations and exposing sensitive data continues to grow. For instance, Bomco disclosed a cyberattack involving unauthorized access to its internal network during June 2025, where attackers gained access to company systems and copied files over a multi-day period before the incident was identified, illustrating the operational and recovery challenges cyber incidents can create for precision manufacturers.
PRECISION PARTS MARKET SEGMENTATION INSIGHTS
INSIGHTS BY COMPONENT TYPE
The global precision parts market by component type is segmented into machined components, forged & stamped components, cast components, and other precision components. The machined component segment accounted for the largest market share of around 40%.
The precision-machined components segment comprises high-accuracy parts manufactured using CNC-based processes such as turning, milling, grinding, honing, drilling, and EDM to achieve tight tolerances and complex geometries. Growing adoption of multi-axis machining, AI-enabled manufacturing, and digital process optimization is improving production efficiency and supporting demand from aerospace, defense, medical, industrial, and electric vehicle applications. While investments in regional machining capacity are strengthening supply chains, challenges such as skilled labor shortages, advanced material machining, and stringent certification requirements continue to shape the market.
INSIGHTS BY MATERIAL TYPE
Based on the machine type, the metal & alloys segment accounted for the largest global precision parts market share in 2025. The metals & alloys segment comprises steel and steel alloys, aluminum, titanium and superalloys, and copper/brass, which remain the primary material categories used in precision parts manufacturing. Steel continues to dominate owing to its strength and machinability, while aluminum supports lightweighting initiatives and titanium and superalloys address high-performance requirements. Demand remains particularly strong in automotive, industrial machinery, rail, and equipment manufacturing, where steel's durability and mechanical performance make substitution difficult.
Copper and brass are gaining importance with increasing electrification, while innovations in advanced alloy processing and additive manufacturing continue to expand material capabilities. However, tariff-related cost pressures, supply constraints, and raw material price volatility remain key challenges across the segment.
INSIGHTS BY END-USER
Based on the end-user, electronics & semiconductor shows highest growth in the global precision parts market, with a CAGR of 6.97% during the forecast period. Precision components are widely used in semiconductor manufacturing equipment, electronics manufacturing systems, testing equipment, telecommunications hardware, and electronic devices. Front-end semiconductor manufacturing operates in highly corrosive, ultra-high-vacuum, and thermally demanding environments, requiring precision components made from high-purity, contamination-resistant materials. Process chambers, gas distribution systems, and wafer processing equipment require complex micro-hole drilling, ultra-flat surfaces, and sub-micron dimensional accuracy to ensure process stability and high production yields.
In addition, the growing adoption of Silicon Carbide (SiC) and Gallium Nitride (GaN) technologies is driving demand for advanced precision machining and grinding capabilities to process hard, brittle, and high-performance materials.
INSIGHTS BY SALES CHANNEL
The global precision parts market by end-user is segmented into direct sales and indirect sales. The direct sales segment accounted for the largest market share in 2025. The direct sales segment represents the primary commercial channel for high-value precision parts, enabling manufacturers to work closely with OEMs, Tier-1 and Tier-2 suppliers, system integrators, and aftermarket customers. Direct engagement supports engineering collaboration, customized component development, quality assurance, and long-term supply agreements throughout the product lifecycle.
As product complexity increases, customers are involving suppliers earlier in development while prioritizing supply chain resilience and strategic partnerships. However, the model requires significant investments in technical expertise, quality systems, customer support, and account management.
PRECISION PARTS MARKET GEOGRAPHICAL ANALYSIS
APAC dominates the global precision parts market, emerging as both the largest and fastest-growing regional hub. It accounts for over 36% of the market share. The region’s leadership is underpinned by global ultra-precision leaders such as Japan and South Korea alongside rapidly expanding manufacturing hubs in China, India, Taiwan, and Thailand.
Among the countries, China is the largest precision parts market by revenue, due to its extensive precision manufacturing ecosystem, strong government-backed industrial policies, large-scale production capacity, and broad demand across automotive, electronics, rail, shipbuilding, medical, and industrial sectors. India, meanwhile, is the fastest‑growing major market in the region, supported by government-led manufacturing initiatives, expanding export competitiveness, rapid localization across aerospace, defense, electronics, semiconductors, and electric vehicles, and a cost-efficient precision manufacturing ecosystem.
The logic behind APAC’s growth is that the region combines global leadership in ultra-precision engineering with large-scale manufacturing capacity, while government-led initiatives are accelerating the localization of semiconductors, electronics, defense, and other strategic industries.
North America is a very important precision parts manufacturing region, supported by strong demand from aerospace, defense, automotive, medical devices, semiconductors, energy, and industrial equipment sectors, along with deeply integrated cross-border supply chains.
Aerospace and defense remain key growth engines, supported by expanding aircraft production programs, large defense procurement backlogs, military modernization initiatives, and increasing demand for high-precision structural, engine, and mission-critical components. The region is benefiting from a strong reshoring and supply-chain localization trend, as manufacturers seek to reduce dependence on overseas suppliers and strengthen resilience against ongoing geopolitical, trade, and logistics disruptions.
PRECISION MARKET COMPETITIVE LANDSCAPE
The global precision parts market is highly fragmented, comprising multinational manufacturers, specialized precision engineering companies, regional suppliers, and contract manufacturers. Large global players compete through diversified manufacturing capabilities, broad geographic presence, long-term OEM relationships, and integrated product portfolios, while regional companies differentiate themselves through specialized expertise, production flexibility, shorter lead times, and collaborative engineering support.
Competitive activity is increasingly centered on acquisitions, capacity expansion, and investments in advanced manufacturing technologies to strengthen market positions and broaden capabilities. At the same time, trade policy changes and supply chain disruptions are accelerating the shift toward regionalized manufacturing, prompting OEMs to prioritize suppliers with localized production, reliable delivery, and resilient supply chains. These trends are reshaping competition and creating new growth opportunities across both global and regional manufacturers.
SNAPSHOT
The global precision parts market size is expected to grow at a CAGR of approximately 10.65% from 2025 to 2031.
The following factors are likely to contribute to the growth of the global precision parts market during the forecast period:
- Rising Investments in Aerospace Parts Manufacturing
- Defense Sector is Driving Precision Parts Demand
- Advance Technology Powering Precision Manufacturing
- Aftermarket Demand Enabling Precision Parts Market
- Government Initiatives Drive Precision Parts Demand
Base Year: 2025
Forecast Year: 2026-2031
The report examines the current state of the global precision parts market and its market dynamics through 2026−2031. It covers a detailed overview of several market growth enablers, restraints, and trends. The study covers both the demand and supply sides of the market. It also profiles and analyses leading companies and several other prominent companies operating in the market.
Key Vendors
- Barnes Aerospace
- Business Overview
- Product Offerings
- Key Developments
- Key Strategies
- Key Strengths
- Key Opportunities
- Impro Precision Industries Limited
- Linamar International
- Martinrea International Inc.
- NN Inc.
- Bharat Forge Limited
- Regal Rexnord
- Suprajit Group
- AccuRounds
- Aequs
Other Prominent Vendors
- Anton Haring KG
- Business Overview
- Product Offerings
- Armor Meca Industries
- Berger Group
- Beyonics PTE LTD
- Booster Precision Components
- Bruder GmbH
- Poppe + Potthoff
- Dongguan Tuoyue Hardware Technology Co., Ltd.
- Bonfiglioli
- Caldwell Manufacturing
- Consolidated Precision Products Corp.
- Coler Supply Solutions
- Dana Incorporated
- Doncasters Group Limited
- The Partner Companies (TPC)
- Fritz Winter
- Greystone
- Hoppe Technologies
- IPE Group Limited
- GE Aerospace
- Kern Liebers
- KPTEC Group
- Macht Technologies Private Limited
- Mecachrome
- Bosch
- Mendritzki Group
- Meiruch & Hiffman GmbH
- Pacific West America Inc.
- Precision Castparts Corp.
- Pursuit Aerospace Inc.
- Petersen Precision Engineering LLC
- Sigma Components
- SKF Group
- SMC Corporation
- Tessa Precision Products Inc.
- Lampin Corporation
- Zollern GmbH
- Rosenberger
- Hartford Technologies
- Precision Resource Inc.
- SPR Group
- Spaleck Group
- Ace Precision Machining Corp.
- Lemor Mechanical Industry Ltd.
- Cox Manufacturing Company Inc.
- Unimech
- SFS Group
- Globo Usinagem
- INDO-MIM
- Protolabs
Segmentation by Component Type
- Machined Component
- Forged & Stamped Component
- Cast Component
- Other Precision Component
Segmentation by Material Type
- Metal & Alloys
- Plastics & Composites
- Others
Segmentation by End-User
- Automotive & Transportation
- Aerospace & Defense
- Industrial Machinery
- Electronics & Semiconductor Equipment
- Energy & Power
- Medical Devices/Healthcare
- Others
Segmentation by Sales Channel
- Direct Sales
- Indirect Sales
Segmentation by Geography
- North America
- U.S.
- Canada
- Europe
- Germany
- France
- UK
- Italy
- Nordics
- Netherlands
- Switzerland
- Poland
- APAC
- China
- Japan
- South Korea
- India
- Australia
- Taiwan
- Thailand
- Latin America
- Brazil
- Mexico
- Argentina
- Middle East Africa
- Saudi Arabia
- UAE
- South Africa
PRECISION PARTS MARKET FAQs
How big is the global precision parts market?
What is the growth rate of the global precision parts market?
What are the key trends in the global precision parts market?
Which region dominates the global precision parts market?
Who are the key vendors in the global precision parts market?
EXHIBIT 1 Global Precision Parts Market 2022-2031 ($ billion)
EXHIBIT 2 Global Precision Parts Market by Component Type 2022-2031 ($ billion)
EXHIBIT 3 Market by Machined Components 2022-2031 ($ billion)
EXHIBIT 4 Market by Forged & Stamped Components 2022-2031 ($ billion)
EXHIBIT 5 Market by Cast Components 2022-2031 ($ billion)
EXHIBIT 6 Market by Other Precision Components 2022-2031 ($ billion)
EXHIBIT 7 Global Precision Parts Market by Material 2022-2031 ($ billion)
EXHIBIT 8 Market by Metals & Alloys 2022-2031 ($ billion)
EXHIBIT 9 Market by Plastics & Composites 2022-2031 ($ billion)
EXHIBIT 10 Market by Other Materials 2022-2031 ($ billion)
EXHIBIT 11 Global Precision Parts Market by End-User 2022-2031 ($ billion)
EXHIBIT 12 Market by Automotive & Transportation 2022-2031 ($ billion)
EXHIBIT 13 Market by Aerospace & Defense 2022-2031 ($ billion)
EXHIBIT 14 Market by Industrial Machinery 2022-2031 ($ billion)
EXHIBIT 15 Market by Semiconductors & Electronics 2022-2031 ($ billion)
EXHIBIT 16 Market by Energy & Power 2022-2031 ($ billion)
EXHIBIT 17 Market by Medical Devices/Healthcare 2022-2031 ($ billion)
EXHIBIT 18 Market by Other Industries 2022-2031 ($ billion)
EXHIBIT 19 Global Precision Parts Market by Sales Channel 2022-2031 ($ billion)
EXHIBIT 20 Market by Direct Sales 2022-2031 ($ billion)
EXHIBIT 21 Market by Indirect Sales 2022-2031 ($ billion)
EXHIBIT 22 North America Precision Parts Market 2022-2031 ($ billion)
EXHIBIT 23 US Precision Parts Market 2022-2031 ($ billion)
EXHIBIT 24 Canada Precision Parts Market 2022-2031 ($ billion)
EXHIBIT 25 APAC Precision Parts Market 2022-2031 ($ billion)
EXHIBIT 26 China Precision Parts Market 2022-2031 ($ billion)
EXHIBIT 27 Japan Precision Parts Market 2022-2031 ($ billion)
EXHIBIT 28 South Korea Precision Parts Market 2022-2031 ($ billion)
EXHIBIT 29 India Precision Parts Market 2022-2031 ($ billion)
EXHIBIT 30 Australia Precision Parts Market 2022-2031 ($ billion)
EXHIBIT 31 Taiwan Precision Parts Market 2022-2031 ($ billion)
EXHIBIT 32 Thailand Precision Parts Market 2022-2031 ($ billion)
EXHIBIT 33 Europe Precision Parts Market 2022-2031 ($ billion)
EXHIBIT 34 Germany Precision Parts Market 2022-2031 ($ billion)
EXHIBIT 35 France Precision Parts Market 2022-2031 ($ billion)
EXHIBIT 36 UK Precision Parts Market 2022-2031 ($ billion)
EXHIBIT 37 Italy Precision Parts Market 2022-2031 ($ billion)
EXHIBIT 38 Nordics Precision Parts Market 2022-2031 ($ billion)
EXHIBIT 39 Netherlands Precision Parts Market 2022-2031 ($ billion)
EXHIBIT 40 Switzerland Precision Parts Market 2022-2031 ($ billion)
EXHIBIT 41 Poland Precision Parts Market 2022-2031 ($ billion)
EXHIBIT 42 Latin America Precision Parts Market 2022-2031 ($ billion)
EXHIBIT 43 Brazil Precision Parts Market 2022-2031 ($ billion)
EXHIBIT 44 Mexico Precision Parts Market 2022-2031 ($ billion)
EXHIBIT 45 Argentina Precision Parts Market 2022-2031 ($ billion)
EXHIBIT 46 Middle East & Africa Precision Parts Market 2022-2031 ($ billion)
EXHIBIT 47 Saudi Arabia Precision Parts Market 2022-2031 ($ billion)
EXHIBIT 48 UAE Precision Parts Market 2022-2031 ($ billion)
EXHIBIT 49 South Africa Precision Parts Market 2022-2031 ($ billion)
LIST OF TABLES
TABLE 1Global Precision Parts Market 2022-2031 ($ billion)
TABLE 2Global Precision Parts Market by Component Type segmentation 2022-2031 ($ billion)
TABLE 3Global Precision Parts Market by Material segmentation 2022-2031 ($ billion)
TABLE 4Global Precision Parts Market by End-User segmentation 2022-2031 ($ billion)
TABLE 5Global Precision Parts Market by Sales Channel segmentation 2022-2031 ($ billion)
TABLE 6Global Precision Parts Market by Geography 2022-2031 ($ billion)
CHAPTER – 1: Global Precision Parts Market Overview
- Executive Summary
- Key Findings
- Key Developments
CHAPTER – 2: Global Precision Parts Market Segmentation Data
- Component Type Market Insights (2022-2031)
- Machined Components
- Forged & Stamped Components
- Cast Components
- Other Precision Components
- Material Market Insights (2022-2031)
- Metals & Alloys
- Plastics & Composites
- Other Materials
- End-User Industry Market Insights (2022-2031)
- Automotive & Transportation
- Aerospace & Defense
- Industrial Machinery
- Semiconductors & Electronics
- Energy & Power
- Medical Devices/Healthcare
- Other Industries
- Sales Channel Market Insights (2022-2031)
- Direct Sales
- Indirect Sales
CHAPTER – 3: Global Precision Parts Market Prospects & Opportunities
- Global Precision Parts Market Drivers
- Global Precision Parts Market Trends
- Global Precision Parts Market Constraints
CHAPTER – 4: Global Precision Parts Market Overview
- Global Precision Parts Market -Competitive Landscape
- Global Precision Parts Market - Key Players
- Global Precision Parts Market - Key Company Profiles
CHAPTER – 5: Appendix
- Research Methodology
- Abbreviations
- Arizton
Select a license type that suits your business needs
Single User Licence
- Report accessible by one user only
- Free 10% or 3 days of customization
- Free post-sale service assistance
- Continuous support through email
5 User Licence
- Report accessible by 5 users within the organization
- Free 15% or 4.5 days of customization
- Continuous support through email and telephone
- Free analyst hour
- Free Upgrade: If an updated report published within 180 days of purchase, you will get the revised report free of charge
Corporate Licence
- Free Datasheet worth $1500
- Report accessible by the entire organization
- Free 20% or 6 days of customization
- Free post-sale service assistance
- Continuous support through email and telephone
- Direct access to lead analysts
- Free analyst hour
- Free Upgrade: If an updated report published within 180 days of purchase, you will get the revised report free of charge
Datasheet Licence
- Report accessible by 1 user only
- Free 15% or 32 hours of customization
- Free post-sale service assistance
- Direct access to lead analysts
Frequently Asked Questions
How big is the global precision parts market?
What is the growth rate of the global precision parts market?
What are the key trends in the global precision parts market?
Which region dominates the global precision parts market?
Who are the key vendors in the global precision parts market?