U.S. IT Staffing Market Research Report 2026-2031
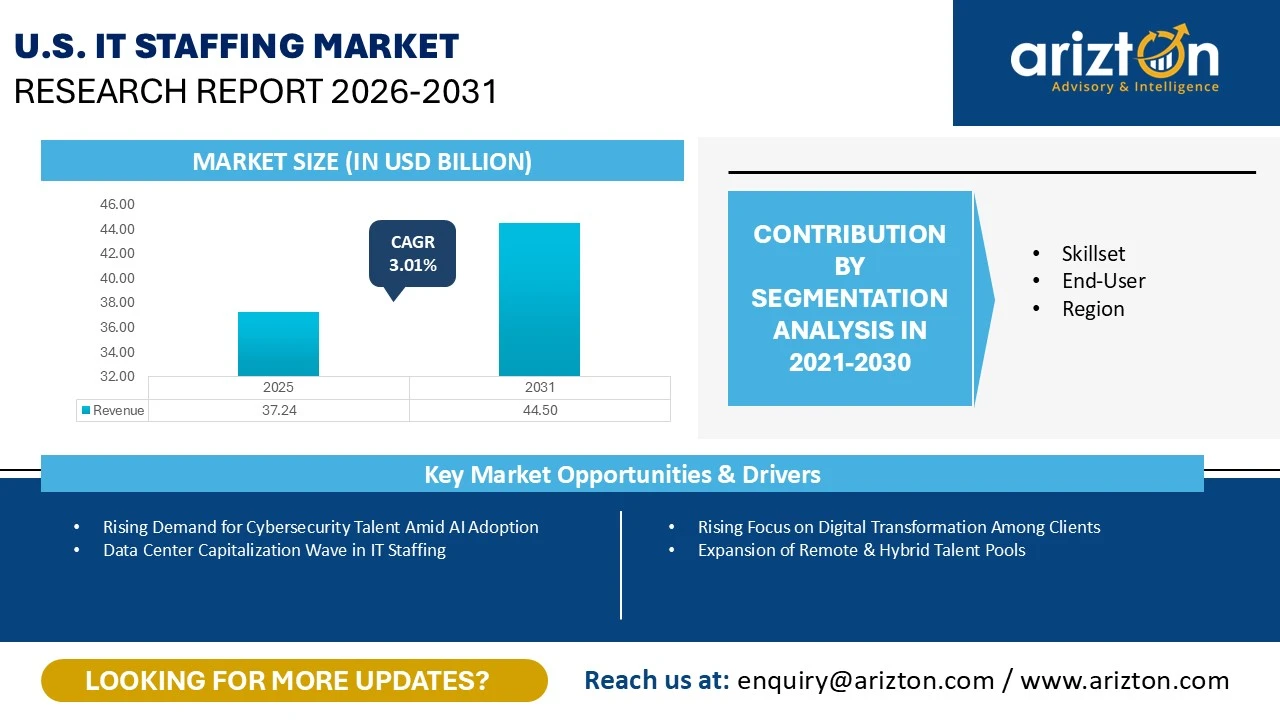
THE U.S. IT STAFFING MARKET WAS VALUED AT USD 37.24 BILLION IN 2025 AND IS PROJECTED TO REACH USD 44.50 BILLION BY 2031, GROWING AT A CAGR OF 3.01% FROM 2025 TO 2031.

U.S. IT Staffing Market Growth Insights – Driven by Data Center Capitalization, Rising Demand for Cybersecurity Talent, Skills-Based Hiring, AI-Powered Recruitment, Digital Transformation Initiatives, and Expanding Remote & Hybrid Workforce Models (2026–2031)
Published Date : July 2026
Last Updated : July 2026
format: PDF
edition : Fifth Edition
131 pages
4 tables
26 charts
45 company
3 segments
4 region
1 countries
Purchase Options
U.S. IT Staffing Market Research Report 2026-2031
THE U.S. IT STAFFING MARKET WAS VALUED AT USD 37.24 BILLION IN 2025 AND IS PROJECTED TO REACH USD 44.50 BILLION BY 2031, GROWING AT A CAGR OF 3.01% FROM 2025 TO 2031.
The U.S. IT Staffing Market Size, Share & Trends Analysis Report By
- Skillset: Software Engineers/Developers/DevOps/Architect, Project Management, QA/Testing, Security, Networking, Cloud Computing, Help Desk/Technical Support, Mobile App Developer, and Others
- End-User: Tech/Telecom, BFSI, Healthcare, Manufacturing, Retail, and Others
- Regions: Midwest, South, West, and Northeast
Industry Analysis Report, Regional Outlook, Growth Potential, Price Trends, Competitive Market Share & Forecast 2026–2031.
This report includes market data points, ranging from trend
analyses to market estimates & forecasts that you can customize
U.S. IT STAFFING MARKET REPORT SCOPE
| REPORT ATTRIBUTE | DETAILS |
|---|---|
| MARKET SIZE (2031) | USD 44.50 Billion |
| MARKET SIZE (2025) | USD 37.24 Billion |
| CAGR (2025-2031) | 3.01% |
| HISTORIC YEAR | 2022-2024 |
| BASE YEAR | 2025 |
| FORECAST YEAR | 2026-2031 |
| SEGMENTS BY | Skillset, End-User, and Region |
| REGIONAL ANALYSIS | Midwest, South, West, and Northeast |
| KEY PLAYERS | Allegis Group, Insight Global, Innova Solutions, Everforth, Inc., and Kforce Inc. |
U.S. IT STAFFING MARKET SIZE & SHARE
The U.S. IT staffing market size was valued at USD 37.24 billion in 2025 and is projected to reach USD 44.50 billion by 2031, growing at a CAGR of 3.01% during the forecast period. The market is experiencing significant growth, driven by several factors, including the data center capitalization wave, rising demand for cybersecurity talent amid AI adoption, a shift toward skills-based hiring, increasing focus on digital transformation among clients, the adoption of AI in recruitment, and the expansion of remote and hybrid talent pools.
Artificial intelligence has significantly transformed the IT staffing pipeline, creating an unprecedented polarization in workforce demand. While traditional frontline IT roles are experiencing a sharp decline due to increasing automation and AI-powered enterprise systems, demand for specialized, high-skilled technology professionals continues to rise.
Key Takeaways
- Skillset: The software engineers/developers/DevOps/architect dominates the U.S. IT staffing market share
- End-User: The healthcare segment shows significant growth, with the fastest-growing CAGR of 3.76% during the forecast period
- Regions: In the U.S. IT staffing market, the South region dominates with a share of over 38%.
Recent Product Developments in the U.S. IT Staffing Market
- In December 2025, Innova Solutions officially introduced AIFICIENT™, an advanced framework engineered to integrate artificial intelligence throughout the entire software design, creation, and deployment lifecycle.
- In October 2025, Allegis Group revolutionized its operational workflows by adopting Azure AI Services and Microsoft 365 Copilot.
- In April 2025, Kforce launched the newly launched AI & Innovation Studio, providing executives with a physical space to confront pressing operational hurdles and pinpoint precisely where technological investments will yield quantifiable value.
IT STAFFING MARKET TRENDS
Data Center Capitalization Wave in IT Staffing
The U.S. IT staffing landscape is experiencing a massive structural realignment due to the "Data Center Capitalization Wave“, a major surge of institutional funding and private equity pouring into AI-focused digital architecture. This shift has elevated data centers from basic real estate properties into high-stakes strategic assets that depend on a highly technical workforce. As a result, this investment surge serves as a dominant market driver, forcing recruitment firms to move away from legacy software development roles and focus heavily on filling specialized infrastructure positions.
Rising Demand for Cybersecurity Talent Amid AI Adoption
Rising demand for cybersecurity talent amid the AI adoption trend highlights a dual challenge: organizations must block sophisticated AI-driven cyber threats while concurrently protecting their own machine learning environments. This shift has become a vital market force because the rapid corporate deployment of Large Language Models (LLMs) has introduced vast new digital vulnerabilities, leaving legacy security practices ineffective. For the U.S. IT staffing market, this evolution acts as a powerful catalyst, rapidly decreasing the demand for entry-level security generalists while fueling an intense hiring wave for highly specialized security engineers.
IT STAFFING MARKET DRIVERS
Rising Focus on Digital Transformation Among Clients
Rising focus on digital transformation among clients is a key driver in the U.S. staffing market. Businesses are actively funding key digital initiatives, focusing heavily on application modernization, enhanced customer experiences, process automation, and cloud transitions. US businesses are moving swiftly from experimental generative AI trials to wide-ranging corporate software rollouts. However, executing this level of digital transformation demands top-down orchestration, with complete buy-in spanning from senior executives to entry-level staff. To ensure a smooth transition, enterprises must deeply audit their information technology infrastructure, software integrations, data governance, operational workflows, and overall corporate culture. Replacing legacy software systems that have been in place for decades relies heavily on a flexible workforce of contract developers, migration experts, and data architects. This continuous cycle of system modernization directly accelerates revenue pipelines for IT staffing providers.
AI in Recruitment
AI in recruitment has emerged as a powerful force radically transforming the U.S. IT staffing landscape. Confronted by an overwhelming influx of technical applications alongside severe deficits in highly specialized skill categories, recruitment firms are progressing beyond elementary automation to deploy fully autonomous AI digital agents. This operational evolution shifts tech recruiters away from manual candidate sourcing to focus on high-impact talent advisory services. By utilizing intelligent software, staffing agencies can rapidly vet technical candidates, predict on-the-job performance, and fully streamline their candidate placement pipelines. For the U.S. IT staffing sector, this shift acts as an aggressive catalyst, completely redefining the day-to-day responsibilities of talent teams by elevating them from repetitive resume sorting and database entry into high-level strategic talent advisors.
INDUSTRY RESTRAINTS
Poor Onboarding & Training
Poor onboarding & training is a major challenge in the U.S. IT staffing market. The American tech recruiting sector operates on a rapid-deployment framework. Consequently, agencies frequently reduce the orientation process to a mere bureaucratic formality, focusing solely on background verifications, tax paperwork, and account provisioning instead of treating it as a vital strategic onboarding initiative. When headhunters lack a thorough grasp of specialized engineering fields, such as cloud infrastructure, DevOps pipelines, or security architectures, they struggle to evaluate talent effectively. This deficiency leads to subpar submittals, eroded client relationships, and financial losses. Furthermore, when contract professionals are deployed without project-focused training, they suffer from delayed output, poor team alignment, and premature project exits. Contract IT professionals assigned to client sites are often left completely without project-specific preparation or integration by their agency. Lacking guidance, these consultants encounter immediate cultural friction or skill gaps, causing them to abandon assignments early or fail to show up for their first day.
U.S. IT STAFFING MARKET SEGMENTATION INSIGHTS
INSIGHT BY SKILLSET
Based on the skillset, the software engineers/developers/DevOps/architect dominates the U.S. IT staffing market share in 2025. The segment's growth is driven by several factors, including escalating infrastructure tool complexity, increasing turnover pressure, the wave of generative AI integration, widespread adoption of DevOps tools, cloud-native development, and the shortage of enterprise developers.
Software engineering professionals are navigating increasingly complex production lifecycles, resulting in a significant rise in developer fatigue across the industry. Recent research by Atlassian indicates that 63% of engineers believe executive leadership lacks a clear understanding of the operational bottlenecks within their technical systems.
The shift from traditional engineering lifecycles to environments that support continuous automated deployment has become essential for modern enterprises. Approximately 61% of enterprises report that adopting DevOps methodologies has directly improved the quality of their product releases.
INSIGHT BY END-USER
Based on the end-user, the healthcare segment shows significant growth, with the fastest-growing CAGR of 3.76% during the forecast period. The segment's growth is driven by several factors, including high skill obsolescence rates, stringent patient privacy requirements, the growing demand for data science and bioinformatics expertise, the need to mitigate operational rework, and the rapid pace of telehealth modernization.
Driven by complex federal data-sharing regulations, the rising number of cyberattacks targeting hospital networks, and the increasing need to integrate generative AI into Electronic Health Record (EHR) systems, the healthcare industry is shifting away from traditional full-time IT recruitment.
Healthcare organizations are increasingly replacing legacy on-premises data repositories with secure cloud-based infrastructure. To support this transition, they are engaging project-specific IT consultants to migrate patient health records into secure, interconnected, multi-tenant cloud environments.
IT STAFFING MARKET IN THE US - REGIONAL ANALYSIS
In the U.S. IT staffing market, the South region dominates with a share of over 38%, followed by the West, Midwest, and Northeast in 2025. The market is driven by several factors, including energy sector & smart-grid capital expansion, the rise of digital banking tech hubs, enterprise aerospace & Defense clusters, rising investment in data centers & semiconductor manufacturing facilities, high reliance on scalable contingent labor, and the Texas-sized tech migration.
The South region has strong demand for IT staffing in the Telecom, FinTech, and Energy/Utilities sectors. Year-end calculations released by the United States Bureau of Labor Statistics reveal that Texas generated 132,500 new employment opportunities between December 2024 and December 2025, marking the most substantial annual payroll expansion recorded across the country.
West region is steadily growing in the U.S. IT staffing market. It is driven by several factors, including a high concentration of large enterprise budgets, strict digital compliance & privacy mandates, hyper-accelerated Gen AI race, highly mature flexible & remote sourcing baseline, and hyperscale cloud architecture demand.
The technology recruitment sector across the Western region, encompassing major innovation markets in California, Washington, and Oregon, is led by specialized staffing providers focused on advanced software engineering, multi-cloud infrastructure development, and information security management.
IT STAFFING MARKET VENDORS
The U.S. IT staffing market is currently consolidated, but it is moving towards a fragmented landscape. The top 8 companies accounted for around 40% of the market share, with the remaining 60% of the market share accounted for by other companies. There is significant competition among the regional and national players in the U.S. IT staffing market. The established legacy staffing providers actively engage in aggressive mergers and acquisitions, absorbing smaller, specialized technical boutique firms to instantly acquire advanced competencies in artificial intelligence and cloud computing infrastructure. Concurrently, multi-billion-dollar market leaders such as Allegis Group, Insight Global, and Everforth, Inc. leverage their vast financial assets to monopolize high-volume, Fortune 500 enterprise accounts. The highly specialized boutique agencies intentionally bypass volume models, dedicating their efforts to capturing premium, high-margin revenue streams within highly complex disciplines like machine learning engineering, data science, and advanced cybersecurity.
SNAPSHOT
The U.S. IT staffing market size is expected to grow at a CAGR of approximately 3.01% from 2025 to 2031.
The following factors are likely to contribute to the growth of the U.S. IT staffing market during the forecast period:
- Rising Focus on Digital Transformation Among Clients
- AI in Recruitment
- Expansion of Remote & Hybrid Talent Pools
Base Year: 2025
Forecast Year: 2026-2031
The report examines the current state of the U.S. IT staffing market and its market dynamics through 2026−2031. It covers a detailed overview of several market growth enablers, restraints, and trends. The study covers both the demand and supply sides of the market. It also profiles and analyses leading companies and several other prominent companies operating in the market.
Key Vendors
- Allegis Group
- Business Overview
- Product Offerings
- Key Developments
- Key Strategies
- Key Strengths
- Key Opportunities
- Insight Global
- Innova Solution
- Everforth, Inc.
- Kforce
Other Prominent Vendors
- ManpowerGroup
- Business Overview
- Product Offerings
- Artech LLC.
- Randstad
- Dexian, LLC
- Kelly Services, Inc.
- Collabera
- Vaco LLC
- Consulting Solutions
- The Judge Group
- INSPYR Solutions
- NTT DATA
- Beacon Hill Solutions Group, LLC
- Adecco
- Express Services, Inc.
- 52 Limited
- VDart
- Robert Half
- Epitec
- CSI Companies
- ALKU
- Peyton Resource Group
- The Planet Group
- Acro Service Corporation
- Mindlance
- CompuCom Systems, Inc.
- Compunnel
- Optomi
- Mastech Digital
- NineHertz
- Rose International
- Toptal, LLC
- System One, Inc.
- TATEEDA GLOBAL
- HAN Staffing
- vTech Solution, Inc
- Yoh
- Unique System Skills
- Motion Recruitment
- Mysoft Heaven (BD) Ltd.
- Harvey Nash
Segmentation by Skillset
- Software Engineers/Developers/DevOps/Architect
- Project Management
- QA/Testing
- Security
- Networking
- Cloud Computing
- Help Desk/Technical Support
- Mobile App Developer
- Others
Segmentation by End-User
- Tech/Telecom
- BFSI
- Healthcare
- Manufacturing
- Retail
- Others
Segmentation by Region
- Midwest
- South
- West
- Northeast
U.S. IT STAFFING MARKET FAQs
How big is the U.S. IT staffing market?
What is the growth rate of the U.S. IT staffing market?
Which region dominates the U.S. IT staffing market?
What are the key trends in the U.S. IT staffing market?
Who are the major players in the U.S. IT staffing market?
EXHIBIT 1 US IT Staffing Market 2022-2031 ($ billion)
EXHIBIT 2 US IT Staffing Market by Skillset 2022-2031 ($ billion)
EXHIBIT 3 Market by Software Engineers/Developers/DevOps/Architect 2022-2031 ($ billion)
EXHIBIT 4 Market by Project Management 2022-2031 ($ billion)
EXHIBIT 5 Market by QA/Testing 2022-2031 ($ billion)
EXHIBIT 6 Market by Security 2022-2031 ($ billion)
EXHIBIT 7 Market by Networking 2022-2031 ($ billion)
EXHIBIT 4 Market by Cloud Computing 2022-2031 ($ billion)
EXHIBIT 5 Market by Help Desk/Technical Support 2022-2031 ($ billion)
EXHIBIT 6 Market by Mobile App Developer 2022-2031 ($ billion)
EXHIBIT 7 Market by Others 2022-2031 ($ billion)
EXHIBIT 8 US IT Staffing Market by End-User 2022-2031 ($ billion)
EXHIBIT 9 Market by Tech/Telecom 2022-2031 ($ billion)
EXHIBIT 10 Market by BFSI 2022-2031 ($ billion)
EXHIBIT 11 Market by Healthcare 2022-2031 ($ billion)
EXHIBIT 12 Market by Manufacturing 2022-2031 ($ billion)
EXHIBIT 11 Market by Retail 2022-2031 ($ billion)
EXHIBIT 12 Market by Others 2022-2031 ($ billion)
EXHIBIT 22 US IT Staffing Market by Region 2022-2031 ($ billion)
EXHIBIT 23 South IT Staffing Market 2022-2031 ($ billion)
EXHIBIT 24 West IT Staffing Market 2022-2031 ($ billion)
EXHIBIT 25 Midwest IT Staffing Market 2022-2031 ($ billion)
EXHIBIT 26 Northeast IT Staffing Market 2022-2031 ($ billion)
LIST OF TABLES
TABLE 1US IT Staffing Market 2022-2031 ($ billion)
TABLE 2US IT Staffing Market by Skillset segmentation 2022-2031 ($ billion)
TABLE 3US IT Staffing Market by End-User segmentation 2022-2031 ($ billion)
TABLE 4US IT Staffing Market by Region 2022-2031 ($ billion)
CHAPTER – 1: US IT Staffing Market Overview
- Executive Summary
- Key Findings
- Key Developments
CHAPTER – 2: US IT Staffing Market Segmentation Data
- Skillset Market Insights (2022-2031)
- Software Engineers/Developers/DevOps/Architect
- Project Management
- QA/Testing
- Security
- Networking
- Cloud Computing
- Help Desk/Technical Support
- Mobile App Developer
- Others
- End-User Market Insights (2022-2031)
- Tech/Telecom
- BFSI
- Healthcare
- Manufacturing
- Retail
- Others
CHAPTER – 3: US IT Staffing Market Prospects & Opportunities
- US IT Staffing Market Drivers
- US IT Staffing Market Trends
- US IT Staffing Market Constraints
CHAPTER – 4: US IT Staffing Market Overview
- US IT Staffing Market -Competitive Landscape
- US IT Staffing Market - Key Players
- US IT Staffing Market - Key Company Profiles
CHAPTER – 5: Appendix
- Research Methodology
- Abbreviations
- Arizton
Select a license type that suits your business needs
Single User Licence
- Report accessible by one user only
- Free 10% or 3 days of customization
- Free post-sale service assistance
- Continuous support through email
5 User Licence
- Report accessible by 5 users within the organization
- Free 15% or 4.5 days of customization
- Continuous support through email and telephone
- Free analyst hour
- Free Upgrade: If an updated report published within 180 days of purchase, you will get the revised report free of charge
Corporate Licence
- Free Datasheet worth $1500
- Report accessible by the entire organization
- Free 20% or 6 days of customization
- Free post-sale service assistance
- Continuous support through email and telephone
- Direct access to lead analysts
- Free analyst hour
- Free Upgrade: If an updated report published within 180 days of purchase, you will get the revised report free of charge
Datasheet Licence
- Report accessible by 1 user only
- Free 15% or 32 hours of customization
- Free post-sale service assistance
- Direct access to lead analysts
Frequently Asked Questions
How big is the U.S. IT staffing market?
What is the growth rate of the U.S. IT staffing market?
Which region dominates the U.S. IT staffing market?
What are the key trends in the U.S. IT staffing market?
Who are the major players in the U.S. IT staffing market?
Other RELATED Reports

Healthcare Staffing Market in US - Industry Outlook and Forecast 2018-2023
Published : November 2017

U.S. Employee Assistance Program Services Market - Industry Outlook and Forecast 2022-2027
Published : August 2022