Global Coding & Marking Ink Market Research Report 2025-2030
THE GLOBAL CODING AND MARKING INK MARKET WAS VALUED AT USD 1.82 BILLION IN 2024 AND IS EXPECTED TO REACH USD 2.60 BILLION BY 2030 GROWING AT A CAGR OF 6.12% DURING THE FORECAST PERIOD.

The Coding & Marking Ink Market Size, Share, & Trends By Product Type, By End-Users, By Technology, By Colorant, & By Geography. This Industry Analysis Covers The Market Size (in USD Billion) For The Above Segments.
Published Date : October 2025
Last Updated : October 2025
format: PDF
edition : Second Edition
226 pages
30 company
5 segments
5 region
22 countries
Purchase Options
Global Coding & Marking Ink Market Research Report 2025-2030
THE GLOBAL CODING AND MARKING INK MARKET WAS VALUED AT USD 1.82 BILLION IN 2024 AND IS EXPECTED TO REACH USD 2.60 BILLION BY 2030 GROWING AT A CAGR OF 6.12% DURING THE FORECAST PERIOD.
The Coding & Marking Ink Market Size, Share, & Trends Analysis Report By
- Product Type: Solvent-based Inks, Water-based Inks, Oil-based Inks, and Other Inks
- End-Users: Food & Beverage (F&Bs), Healthcare, Electrical Equipment & Electronics (EE&E), Chemicals & Construction (C&C), Automotive & Aerospace (A&A), and Other End-users
- Technology Type: Continuous Inkjet (CIJ), Thermal Inkjet (TIJ), Piezo Inkjet (PIJ), and Valve Inkjet (VIJ)
- Colorant: Dyes and Pigments
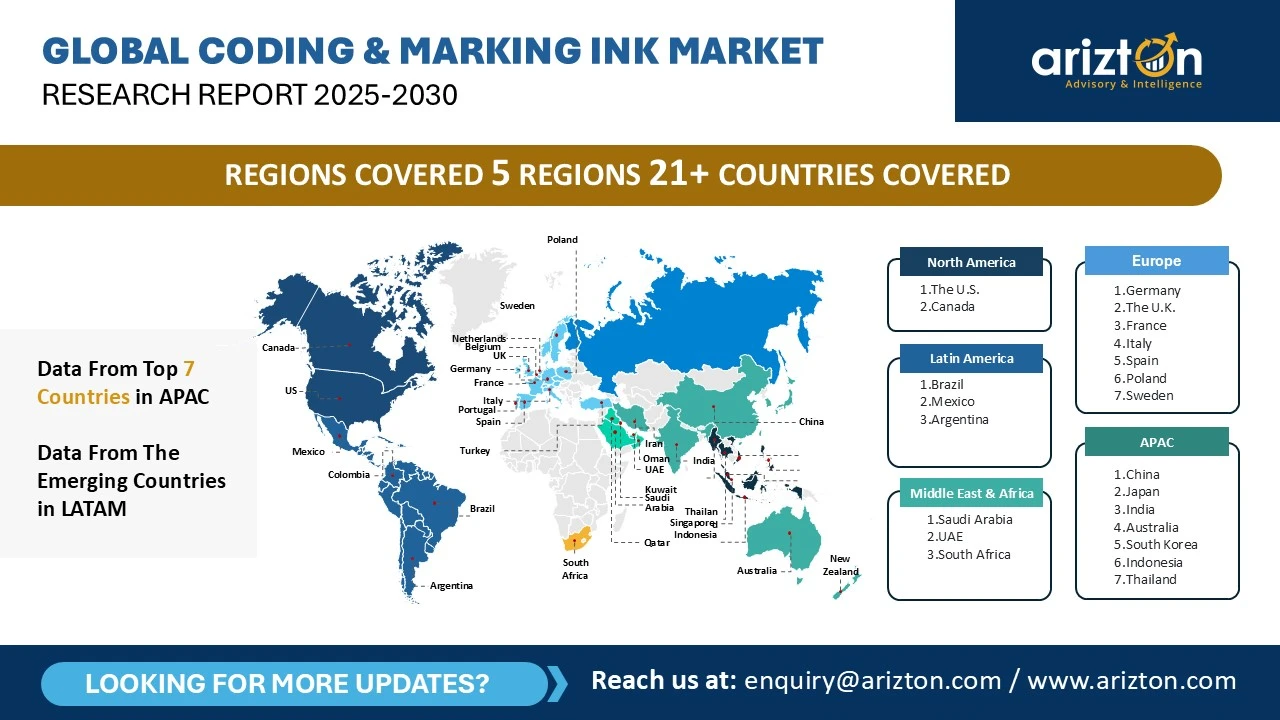
- Geography: North America, Europe, APAC, Latin America, and Middle East & Africa
Industry Analysis Report, Regional Outlook, Growth Potential, Price Trends, Competitive Market Share & Forecast 2025–2030.
This report includes market data points, ranging from trend
analyses to market estimates & forecasts that you can customize
CODING AND MARKING INK MARKET REPORT SCOPE
| REPORT ATTRIBUTE | DETAILS |
|---|---|
| Market Size (2030) | USD 2.60 Billion |
| Market Size (2024) | USD 1.82 Billion |
| CAGR (2024-2030) | 6.12% |
| HISTORIC YEAR | 2021-2023 |
| BASE YEAR | 2024 |
| FORECAST YEAR | 2025-2030 |
| SEGMENTS BY | Product Type, End-Users, Technology, Colorant, and Geography |
| GEOGRAPHIC ANALYSIS | North America, Europe, APAC, Latin America, and Middle East & Africa |
| KEY PLAYERS | Domino Printing Sciences plc, Hitachi Industrial Equipment Systems (HIES), ITW Diagraph, Kao Advanced Printing Solutions (APS), Markem-Imaje, and Videojet Technologies |
CODING & MARKING INK MARKET SIZE ANALYSIS
The global coding and marking ink market size was valued at USD 1.82 billion in 2024 and is expected to reach USD 2.60 billion by 2030, growing at a CAGR of 6.12% during the forecast period, driven by stricter regulatory requirements, the rising importance of product traceability, and advancements in printing technologies. Coding and marking play a crucial role in the product supply chain. This process involves imprinting information and data on products and their packaging, facilitating an efficient tracking and tracing process across the supply and distribution chain.
The demand for these inks is driven by the introduction of diverse printing technologies. Coding and marking inks are specially formulated for specific applications in both primary and secondary packaging across various industries. Currently, vendors offer multiple printing solutions, with demand varying across end-use products such as beverage cans, bottles, engine chassis, and car interiors.
IMPACT OF TARIFF
The impact of tariff on coding & marking will be moderate. The tariff war affects the cost of pigments, dyes, and solvents, key raw materials for inks. While local sourcing mitigates some risks, manufacturers reliant on imports face higher input costs, supply chain disruptions, and reduced pricing flexibility. This exerts moderate pressure on production costs and competitiveness across the regional market.
CODING & MARKING INK MARKET TRENDS
Growing Innovations in Coding and Marking Inks
Several vendors catering to the coding & marking ink market have consistently focused on upcoming and new forms of inks or similar solutions for customers. Vendors such as Domino Printing Sciences, Paul Leibinger Inkjet Systems, and Weber Marking Systems, among others, have remained successful in guiding this headwind to their advantage. However, the influx of local vendors has had them own share of success in the same.
Growing Trend of Developing Eco-friendly Inks
The need to have inks that can be removed has risen considerably in the last few years. For instance, several manufacturers across end-user industries are currently seeking inks that are long-lasting, durable, and removable at the end-of-life point if the product is to be recycled. This seems challenging even though the same trend can be expected to become mainstream in the coming years.
Rising Trend of Paper-based Packaging
The global packaging industry is undergoing a strong shift toward paper and fiber-based solutions, driven by sustainability commitments, regulatory pressure, and consumer preference. Governments, especially in the EU and North America, are pushing packaging regulations that prioritize recyclability and the reduction of plastic. There is rising trend of paper-based packaging due to increasing focus on sustainability.
CODING & MARKING INK MARKET DRIVERS
Growing Demand for Product Traceability
There is growing demand for product traceability due to growing regulatory pressure, financial risk, rising consumer safety concerns and recall of faulty products across the world. This development is driving the demand for coding and marking solutions, including inks, which play a pivotal role in ensuring products are properly labeled, serialized, and tracked across the supply chain.
Increasing Application in Food & Beverage and Healthcare Industries
The expansion of end-user industries such as food & beverage and healthcare has led to a rise in demand for coding and marking solutions such as bar codes, dates, manufacturing details, and other relevant product information. Also, the need to have such information intact throughout the entire supply chain process remains imminent and necessary. Growing application of coding and marking solutions in food & beverage and healthcare industries will drive demand for high quality coding and marking inks.
Stringent Labeling Regulations
Governments across the globe have introduced stringent labeling regulations for product quality, safety, and traceability. Several industries are required to label their products with specific information, such as lot numbers, expiration dates, ingredients, and barcodes, due to regulations. The government organizations have made product labeling mandatory for maintaining product quality and consumer safety. As regulatory requirements continue to increase globally, the demand for coding and marking solutions, including inks, is expected to grow.
INDUSTRY RESTRAINTS
Growing Popularity of Laser Marking Systems
Laser coding is gaining popularity owing to its ability to reduce production downtime while boosting productivity. Since laser marking neither transmits any ink onto any surface nor requires a physical tool impacting that surface, it is a key choice among end-user industry manufacturers.
Ink Migration Challenge
One of the key challenges in the coding & marking ink market is ink migration onto packaged materials. Ink migration occurs when chemicals from printing inks, labels, or coatings leach into the food. Vendors can look up to different alternative solutions for coding and marking to avoid ink migration issues that can negatively impact demand for inks in the market.
CODING & MARKING INK MARKET SEGMENTATION INSIGHTS
INSIGHTS BY PRODUCT TYPE
The global coding and marking inks market by product type is segmented into solvent-based inks, water-based inks, oil-based inks, and other inks. The solvent-based inks segment accounted for the largest market share of over 50%. Solvent-based inks use solvents as their key carrier fluids. These inks have solvents that are primarily volatile organic compounds. This feature of the ink tends to make them dry quite faster than their counterparts. Solvent-based inks have large applicability in areas such as automotive, production date, serial number, logo, and barcodes, among others, via solvent-based ink, the surfaces become smoother.
Solvent-based inks are of two types – strong solvent and eco-solvent, and are widely used for coding and marking in different industries. MapleJet offers inks like Aspro, Chronplast S, Chronplast Elite, and Dynaplast, which work well on plastic, metal, glass, and food packaging. These inks are useful for industries such as food, beverages, and cosmetics.
INSIGHTS BY TECHNOLOGY TYPE
Based on the technology type, in 2024, the CIJ technology segment accounted for the largest global coding and marking inks market share. CIJ systems support the broadest variety of coding & marking inks, including water-based, oil-based, and solvent-based inks, making them ideal for industrial environments. While CIJ can accommodate UV inks, such usage is less prevalent, and hot melt compatibility is rare. These printers are the standard for food, beverage, and general manufacturing sectors, with solvent-based inks being the most widely adopted.
The CIJ coding and marking technique is highly favored due to its user-friendly installation process. One of its primary advantages is high-speed printing combined with its "quick-dry" capability. This technology is extremely versatile, allowing for printing on nearly any surface. Its installation is relatively straightforward, making it a standard solution for many coding applications.
INSIGHTS BY COLORANT
By colorant, the dyes segment dominates the global coding & marking ink market share, driven by low-cost, high-speed CIJ printing on porous substrates. A dye colorant is transparent and does not provide strong lightfastness or heat-resistant properties. The inks with these colorants are suitable for products that are expected to remain indoors and away from extreme weather conditions. Also, these colorants do not require stirring or shaking, making them an adequate match to be used with inkjet coders.
Dye-based inks are also preferred due to their better color gamut in comparison to their pigment counterparts, while having used an equal number of colors. Several vendors, including Linx Printing Technologies, provide dye-based inks that deliver a strong contrast for a wide range of substrates.
INSIGHTS BY END-USER
The global coding and marking inks market by end-user is categorized into food & beverage (F&Bs), healthcare, electrical equipment & electronics (EE&E), chemicals & construction (C&C), automotive & aerospace (A&A), and other end-users. The food & beverages industry has emerged as one of the largest end-user segments driving demand for coding and marking inks worldwide. As the sector expands across geographies, fueled by innovation, rising consumer spending, and changing dietary preferences, the role of coding and marking solutions has become critical for compliance, traceability, and brand integrity.
One of the key growth drivers is the surge in pre-packaged food products and the multiplication of stock-keeping units (SKUs). For instance, in the US grocery channel alone, SKUs have risen by 50% in the last seven years, reflecting the growing product diversity. This expansion has amplified the need for robust coding solutions to ensure accurate labeling, serialization, and identification across a wide range of product categories.
The rise of Gen Z and millennial demographics has led to a growing demand for organic and healthy food options. This trend toward healthier eating habits among these demographic groups has prompted F&B companies to innovate and introduce ready-to-eat food products. Notably, a significant portion of the American population, around 65%, prioritizes socially conscious and healthy food choices.
CODING & MARKING INK MARKET GEOGRAPHICAL ANALYSIS
APAC dominates the global coding & marking market and accounts for the largest share of around 35% in 2024. The industry is experiencing significant growth, led by stricter regulatory frameworks, rapid industrialization, and a rising need for product traceability. Several end-user industries in the region, such as pharmaceuticals, F&B, automotive, electronics, and consumer goods are adopting innovative coding technologies to ensure compliance and improve the supply chain.
Countries like China and India experience rapid urban population growth, driving the consumption of processed foods, healthcare products, and consumer goods. This urbanization trend, combined with expanding e-commerce penetration and organized retail growth, creates sustained demand for coding and marking systems.
North America represents a significant market for coding and marking technologies, with applications spanning several industries, including pharmaceuticals, food & beverage (F&B), and packaging. The growth in this region is driven by several factors, including stringent regulatory requirements, advances in automation, and an increasing need for product traceability.
The US stands out as the largest market for coding and marking within North America. The e-commerce industry has experienced remarkable growth recently, contributing to the anticipated expansion of offline retail. Categories such as personal care and pet food are predicted to generate high volumes in e-commerce. The rise in Stock Keeping Units (SKUs) within the e-commerce sector is expected to significantly influence the demand for coding and marking systems in the coming years.
CODING & MARKING INK MARKET VENDOR LANDSCAPE
The global coding and marking inks market is highly fragmented, with numerous local and international players. Key companies in this sector include Videojet, Markem-Imaje, Domino Printing Sciences, Hitachi Industrial Equipment Systems, and ITW (Diagraph), along with many domestic manufacturers that cater to local demands and regulations. These firms have established themselves as leaders in the market, boasting strong brand recognition, a wide range of products, and extensive distribution networks.
The market is characterized by a diverse array of global and regional vendors. As international companies expand their presence, regional vendors may find it increasingly difficult to compete. Furthermore, with the rise of product expansions, mergers and acquisitions are expected to intensify competition within the industry. Companies also compete based on features such as safety, durability, tool performance, lifespan, price, and customization options.
Recent Developments in the Coding And Marking Inks Market
- Markem-Imaje, part of Dover, announced the launch of MB2253, a new black MEK ink specifically formulated for the beverage market in June 2025. This innovative product meets stringent industry regulations and ensures safety and compliance for both producers and consumers.
- In January 2025, Hitachi Industrial Equipment launched a food quality visualization solution with time-temperature sensing ink, which changes color based on elapsed time and temperature, and enables cost-effective quality monitoring in the supply chain.
SNAPSHOT
The global coding and marking inks market size is expected to grow at a CAGR of approximately 6.12% from 2024 to 2030.
The following factors are likely to contribute to the growth of the global coding and marking inks market during the forecast period:
- Growing Demand for Product Traceability
- Increasing Application in Food & Beverage and Healthcare Industries
- Stringent Labeling Regulations
Base Year: 2024
Forecast Year: 2025-2030
The report considers the present scenario of the global coding and marking inks market and its market dynamics for 2025−2030. It covers a detailed overview of several market growth enablers, restraints, and trends. The study covers both the demand and supply sides of the market. It also profiles and analyzes leading companies and several other prominent companies operating in the market.
Key Company Profiles
- Domino Printing Sciences plc
- Business Overview
- Product Offerings
- Key Developments
- Key Strategies
- Key Strengths
- Key Opportunities
- Hitachi Industrial Equipment Systems (HIES)
- ITW Diagraph
- Kao Advanced Printing Solutions (APS)
- Markem-Imaje
- Videojet Technologies
Other Prominent Company Profiles
- American Coding & Marking Ink
- Business Overview
- Product Offerings
- Anser Coding Inc.
- Cyklop
- Linx Printing Technologies
- Leibinger Group
- Wuhan Willita Marking & Packing Technology
- Zanasi
- Macsa ID
- Control Print
- UNITED BARCODE SYSTEMS (UBS)
- RN Mark Inc.
- Matthews Marking Systems
- Squid Ink
- Kartho Coding & Marking
- Maple Jet
- KIMAC
- GEM Gravure
- REA Elektronik
- Sun Chemical
- HAS Systems
- Ubach Inkjet
- Weber Marking System
- Wuhan Viojet Technology Co.
- Sojet Marking Technology
Segmentation by Product Type
- Solvent-based Inks
- Water-based Inks
- Oil-based Inks
- Other Inks
Segmentation by Technology
- Continuous Inkjet (CIJ)
- Thermal Inkjet (TIJ)
- Piezo Inkjet (PIJ)
- Valve Inkjet (VIJ)
Segmentation by Colorant
- Dyes
- Pigments
Segmentation by End-users
- Food & Beverage (F&Bs)
- Healthcare
- Electrical Equipment & Electronics (EE&E)
- Chemicals & Construction (C&C)
- Automotive & Aerospace (A&A)
- Other End-users
Segmentation by Geography
- APAC
- China
- Japan
- India
- Australia
- South Korea
- Indonesia
- Thailand
- North America
- The U.S.
- Canada
- Europe
- Germany
- The U.K.
- France
- Italy
- Spain
- Poland
- Sweden
- Latin America
- Brazil
- Mexico
- Argentina
- Middle East & Africa
- Saudi Arabia
- UAE
- South Africa
CODING AND MARKING INK MARKET FAQs
Which region dominates the global coding and marking inks market?
How big is the global coding and marking inks market?
What is the growth rate of the global coding and marking inks market?
What are the key drivers of the global coding and marking inks market?
Who are the major players in the global coding and marking inks market?
For more details, please reach us at [email protected]
1. Scope & Coverage
- Market Definition
- Inclusions
- Exclusions
- Market Estimation Caveats
- Market Size & Forecast Periods
- Historic Period: 2021-2023
- Base Year: 2024
- Forecast Period: 2025-2030
- Market Size (2021-2030)
- Revenue
- Market Segments
- Market Segmentation by Product Type
- Market Segmentation by End-user
- Market Segmentation by coding & marking Technology
- Market Segmentation by Colorant
2.OpportunityPockets
3. Introduction
- Impact Of Tariff
4. Market Opportunities & Trends
- Growing Innovations in Coding and Marking Inks
- Growing Trend of Developing Eco-friendly Inks
- Rising Trend of Paper-based Packaging
5. Market Growth Enablers
- Growing Demand for Product Traceability
- Increasing Application in Food & Beverage and Healthcare Industries
- Stringent Labeling Regulation
6. Market Restraints
- Growing Popularity of Laser Marking System
- Ink Migration Challenge
- Supply Chain Challenges
7. Market Landscape
Five Forces Analysis
8. Product Type (Market Size & Forecast: 2021-2030)
- Solvent-based Inks
- Water-based Inks
- Oil-based Inks
- Other Inks
9. By End-users (Market Size & Forecast: 2021-2030)
- Food & Beverage (F&Bs)
- Healthcare
- Electrical Equipment & Electronics (EE&E)
- Chemicals & Construction (C&C)
- Automotive & Aerospace (A&A)
- Other End-users
10. Technology (Market Size & Forecast: 2021-2030)
- Continuous Inkjet (CIJ)
- Thermal Inkjet (TIJ)
- Piezo Inkjet (PIJ)
- Valve Inkjet (VIJ)
11. Colorant (Market Size & Forecast: 2021-2030)
- Dyes
- Pigments
12. Geography
- APAC
- North America
- Europe
- Latin America
- Middle East & Africa
13. Competitive Landscape
14. Competitive Overview
15. Key Company Profiles
- Domino Printing Sciences plc
- Hitachi Industrial Equipment Systems (HIES)
- ITW Diagraph
- Kao Advanced Printing Solutions (APS)
- Markem-Imaje
- Videojet Technologies
16. Other Prominent Company Profiles
- American Coding & Marking Ink
- Anser Coding Inc.
- Cyklop
- Linx Printing Technologies
- Leibinger Group
- Wuhan Willita Marking & Packing Technology
- Zanasi
- Macsa ID
- Control Print
- UNITED BARCODE SYSTEMS (UBS)
- RN Mark Inc.
- Matthews Marking Systems
- Squid Ink
- Kartho Coding & Marking
- Maple Jet
- KIMAC
- GEM Gravure
- REA Elektronik
- Sun Chemical
- HAS Systems
- Ubach Inkjet
- Weber Marking System
- Wuhan Viojet Technology Co.
- Sojet Marking Technology
17. Report Summary
- Key Takeaways
- Strategic Recommendations
Select a license type that suits your business needs
Single User Licence
- Report accessible by one user only
- Free 10% or 3 days of customization
- Free post-sale service assistance
- Continuous support through email
5 User Licence
- Report accessible by 5 users within the organization
- Free 15% or 4.5 days of customization
- Continuous support through email and telephone
- Free analyst hour
- Free Upgrade: If an updated report published within 180 days of purchase, you will get the revised report free of charge
Corporate Licence
- Free Datasheet worth $1500
- Report accessible by the entire organization
- Free 20% or 6 days of customization
- Free post-sale service assistance
- Continuous support through email and telephone
- Direct access to lead analysts
- Free analyst hour
- Free Upgrade: If an updated report published within 180 days of purchase, you will get the revised report free of charge
Datasheet Licence
- Report accessible by 1 user only
- Free 15% or 32 hours of customization
- Free post-sale service assistance
- Direct access to lead analysts
Frequently Asked Questions
Which region dominates the global coding and marking inks market?
How big is the global coding and marking inks market?
What is the growth rate of the global coding and marking inks market?
What are the key drivers of the global coding and marking inks market?
Who are the major players in the global coding and marking inks market?
Other RELATED Reports