APAC Coding & Marking Ink Market Research Report 2025-2030
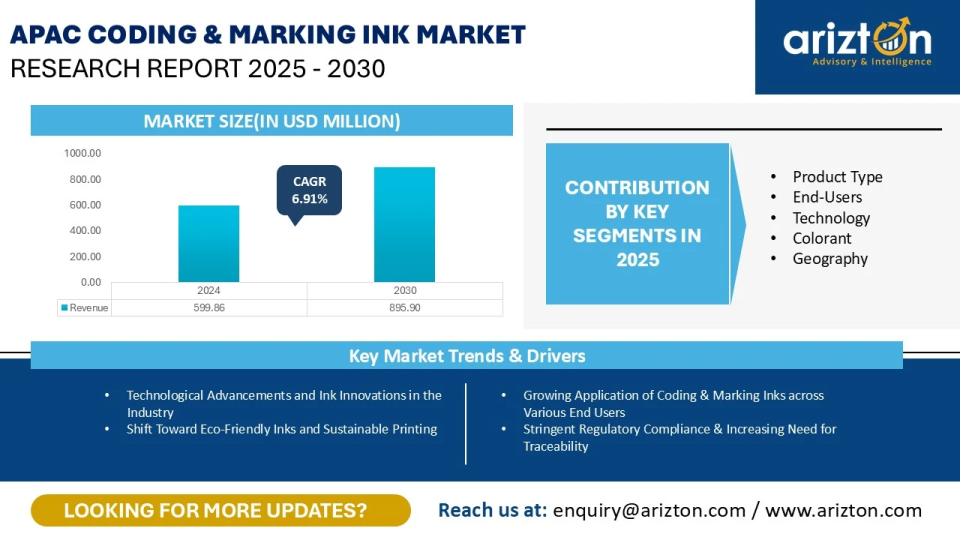
THE APAC CODING AND MARKING INKS MARKET WAS VALUED AT USD 599.86 MILLION IN 2024 AND IS EXPECTED TO REACH USD 895.90 MILLION BY 2030, GROWING AT A CAGR OF 6.91% DURING THE FORECAST PERIOD.

APAC Coding & Marking Ink Market Size, Share, & Trends By Product Type, By End-Users, By Technology, By Colorant, & By Geography. This Industry Analysis Covers The Market Size (in USD Million) For The Above Segments.
Published Date : October 2025
Last Updated : October 2025
format: PDF
edition : Second Edition
187 pages
1 region
11 countries
27 company
5 segments
Purchase Options
APAC Coding & Marking Ink Market Research Report 2025-2030
THE APAC CODING AND MARKING INKS MARKET WAS VALUED AT USD 599.86 MILLION IN 2024 AND IS EXPECTED TO REACH USD 895.90 MILLION BY 2030, GROWING AT A CAGR OF 6.91% DURING THE FORECAST PERIOD.
The Asia-Pacific Coding & Marking Ink Market Size, Share, & Trends Analysis Report By
- Product Type: Solvent-based Inks, Water-based Inks, Oil-based Inks, and Other Inks
- End-Users: Food & Beverage (F&Bs), Healthcare, Electrical Equipment & Electronics (EE&E), Chemicals & Construction (C&C), Automotive & Aerospace (A&A), and Other End-users
- Technology: Continuous Inkjet (CIJ), Thermal Inkjet (TIJ), Piezo Inkjet (PIJ), and Valve Inkjet (VIJ)
- Colorant: Dyes and Pigments
- Geography: APAC (China, Japan, India, Australia, South Korea, Indonesia, Singapore, Thailand, Vietnam, Malaysia, and the Rest of APAC)
Industry Analysis Report, Regional Outlook, Growth Potential, Price Trends, Competitive Market Share & Forecast 2025–2030.
This report includes market data points, ranging from trend
analyses to market estimates & forecasts that you can customize
APAC CODING AND MARKING INKS MARKET REPORT SCOPE
| REPORT ATTRIBUTE | DETAILS |
|---|---|
| Market Size (2030) | USD 895.90 Million |
| Market Size (2024) | USD 599.86 Million |
| CAGR (2024-2030) | 6.91% |
| HISTORIC YEAR | 2021-2023 |
| BASE YEAR | 2024 |
| FORECAST YEAR | 2025-2030 |
| SEGMENTS BY | Product Type, End-Users, Technology, Colorant, and Geography |
| REGIONAL ANALYSIS | China, Japan, India, Australia, South Korea, Indonesia, Singapore, Thailand, Vietnam, Malaysia, and the Rest of APAC |
| KEY PLAYERS | Hitachi Industrial Equipment Systems (HIES), Domino Printing Sciences plc, Videojet Technologies, Kao Advanced Printing Solutions (APS), ITW Diagraph, Control Print Limited, Markem-Imaje, and Matthews Marking Systems |
APAC CODING & MARKING INK MARKET SIZE OUTLOOK
The Asia-Pacific coding and marking inks market size was valued at USD 599.86 million in 2024 and is expected to reach USD 895.90 million by 2030, growing at a CAGR OF 6.91% during the forecast period. The growth is primarily driven by rising demand for product identification and traceability across industries such as food and beverage (F&B), healthcare, and the chemicals sector. Regulatory compliance with strict labeling and safety standards further fuels this demand, while advancements in eco-friendly and high-performance ink formulations continue to accelerate the adoption of these products.
Furthermore, the accelerating shift toward digitalization and the integration of IoT within packaging solutions are anticipated to open up new opportunities for market players.
IMPACT OF TARIFF
The impact of the tariff on coding & marking will be moderate. The tariff war affects the cost of pigments, dyes, and solvents, key raw materials for inks. While local sourcing mitigates some risks, manufacturers reliant on imports face higher input costs, supply chain disruptions, and reduced pricing flexibility. This exerts moderate pressure on production costs and competitiveness across the regional market.
APAC CODING & MARKING INK MARKET TRENDS & DRIVERS
Technological Advancements and Ink Innovations in the Industry
The coding & marking industry is growing rapidly with advances in technology, improving efficiency, and accuracy across sectors. Improvements in printhead technology and ink formulations have enhanced print speed, quality, and durability, ensuring that markings remain clear throughout the lifecycle of a product.
Shift Toward Eco-Friendly Inks and Sustainable Printing
The increasing emphasis on sustainable and environmentally friendly packaging and label printing practices is one of the key trends in the coding and marking ink market. As environmental concerns continue to rise, consumers and regulatory bodies push for more eco-friendly solutions throughout the supply chain. Water-based and UV-curable inks continue to gain popularity as possible alternatives owing to their reduced environmental impact and better safety standards.
Growing Application of Coding & Marking Inks across Various End Users
Coding and marking inks witnessed a surge in use across the Asia-Pacific. This is primarily due to rising demand from key industries like F&B, healthcare, electronics, and automotive. These sectors are increasingly relying on coding and marking systems to meet crucial needs, including ensuring product traceability, meeting regulatory requirements, protecting consumer safety, and combating product duplication.
Stringent Regulatory Compliance & Increasing Need for Traceability
In the Asia-Pacific, the push for stricter regulatory compliance has emerged as one of the most critical factors shaping the coding and marking ink industry. Recently, regulatory bodies across the Asia-Pacific have introduced stringent labeling guidelines to elevate consumer safety, ensure traceability, and promote informed decision-making.
INDUSTRY RESTRAINTS
Increasing Prominence of Laser Printing Technology
The growing prominence of laser printing technology in coding and marking is poised to negatively impact the growth of the coding & marking ink market, especially in APAC, as industrial sectors increasingly shift toward laser solutions that do not require ink or solvents.
As more manufacturers in the Asia-Pacific adopt laser marking for high-precision and traceability needs, demand for coding inks drops, since lasers do not require consumables for each mark, unlike inkjet or thermal transfer printers.
APAC CODING & MARKING INK MARKET SEGMENTATION INSIGHTS
INSIGHTS BY PRODUCT TYPE
The Asia-Pacific coding and marking inks market by product type is segmented into solvent-based inks, water-based inks, oil-based inks, and other inks. The solvent-based inks segment accounted for the largest market share of over 50%. The solvent-based inks market plays a crucial role in modern manufacturing and packaging industries. These inks are used in industrial printing systems, primarily continuous inkjet (CIJ), drop-on-demand (DOD), and thermal inkjet (TIJ) to apply variable data such as batch numbers, expiration dates, barcodes, QR codes, and regulatory markings on a wide range of substrates.
Its primary advantage lies in its ability to quickly dry on non-porous or semi-porous surfaces like plastics, glass, metals, laminates, and films, making it ideal for fast-paced production lines.
These inks are formulated with volatile organic solvents such as MEK (methyl ethyl ketone), acetone, or ethanol, which allow for rapid evaporation and strong adhesion. MEK-based inks continue to dominate the market due to their excellent performance, particularly on difficult substrates like polypropylene and polyethylene.
INSIGHT BY END USERS
Based on the end users, in 2024, the food & beverages segment accounted for the largest Asia-Pacific coding & marking ink market share. The industry is expanding rapidly, driven by high volumes but constrained by low margins. In this competitive environment, manufacturers and contract packers are under pressure to reduce production costs and enhance operational efficiency.
Similarly, the confectionery sector faces its own set of challenges, most notably, the need for fast-drying, taint-free inks that can support high-speed production lines. Across the F&B industry, coding and marking inks have become essential for maintaining traceability, compliance, and branding.
As the APAC F&B sector continues to grow, so does the demand for effective coding and marking solutions. The emergence of new markets and the proliferation of stock-keeping units (SKUs) have further fueled the need for robust, flexible marking technologies. This growth is also supported by rising consumer spending and an increased appetite for packaged food products.
INSIGHT BY TECHNOLOGY
By technology, the CIJ technology segment shows significant growth, with the fastest-growing CAGR of 6.97% during the forecast period. CIJ technology is among the most widely adopted solutions in the coding and marking industry. It is a non-contact printing method that continuously generates ink droplets from a high-pressure pump, directing them through a nozzle to mark substrates such as plastics, metals, and paper.
Inside the printer, a piezoelectric crystal creates vibrations that break the ink flow into minute droplets, which are precisely guided by an electrostatic field to form the required codes and characters. A key advantage of this system is its compatibility with a broad range of surfaces, including curved, uneven, or irregular materials, making it particularly suitable for packaging applications.
Another strength of CIJ printers is their speed, as some models can produce up to 1,000 characters per second. Alongside these attributes, they remain cost-effective due to relatively low ink prices and limited maintenance requirements.
INSIGHT BY COLORENT
The Asia-Pacific coding and marking inks market by colorant is categorized into dyes and pigments. Dye-based colorants at present dominate the APAC coding and marking ink market. Dye-based colorants are transparent and generally offer lower resistance to light and heat. As such, these inks are best suited for applications where products remain indoors and are not exposed to harsh environmental conditions.
One key advantage of dye colorants is their ease of use; they do not require stirring or shaking, making them highly compatible with inkjet coding systems. In addition, dye-based inks are more cost-effective, making them a preferred option in many cases where high durability is not critical.
While dye-based inks now face increasing competition from pigment-based alternatives, especially in applications demanding higher durability, they continue to be the standard in inkjet printing. As a result, demand for dye-based coding and marking inks is expected to remain stable throughout the forecast period.
APAC CODING & MARKING INK MARKET GEOGRAPHICAL ANALYSIS
China dominates and holds the largest share of the Asia-Pacific coding and marking inks market. The market represents one of the most dynamic and rapidly evolving segments within the Asia Pacific region, driven by robust manufacturing growth, technological advancements, and increasingly stringent regulatory requirements.
The market has experienced significant expansion; this is in addition to China's transformation from a manufacturing supplier to a manufacturing powerhouse under the "Made in China 2025" strategic initiative.
China's electronic information manufacturing sector, a key driver of the coding and marking ink demand, has demonstrated remarkable resilience and growth. According to the Ministry of Industry and Information Technology, the value-added industrial output of the major companies in the electronic information manufacturing sector rose by around 11% year-on-year during the first five months of 2025.
The Japan coding & marking inks market is poised for steady expansion, supported by stringent regulatory requirements for product traceability, the rising adoption of automated production lines, and growing demand across key end-user industries.
Japan's growth is driven by technological advancements and the expanding application of industrial technologies. The country is renowned for its cutting-edge manufacturing sector, particularly in high-tech fields such as automotive, electronics, and robotics. As industrial production continues to rise, the demand for coding and marking systems used in these industries will increase.
APAC CODING & MARKING INK MARKET VENDOR LANDSCAPE
The Asia-Pacific coding & marking inks market is highly fragmented, with several local and international players. Videojet Technologies, Markem-Imaje, Domino Printing Sciences plc, Hitachi Industrial Equipment Systems, Kao Advanced Printing Solutions, ITW Diagraph, and Control Print are some of the key players; furthermore, the market comprises domestic manufacturers specialized in manufacturing coding and marking ink based on local demands and regulations.
These companies have established themselves as leading players in the market, accounting for strong brand recognition, a wide range of products, extensive distribution networks, and a network of subsidiaries. Companies compete on product quality, innovation, customer service, and price to gain market share and differentiate themselves from competitors.
Recent Developments in the Asia-Pacific Coding And Marking Inks Market
- In January 2025, Hitachi launched a food quality visualization solution with time-temperature sensing ink, which changes color based on elapsed time and temperature; this enables cost-effective quality monitoring in the supply chain.
- In March 2024, Control Print obtained majority ownership in the Codeology Group, a company based in the UK. Codeology Group specializes in the production of high-capacity inkjet printers.
SNAPSHOT
The APAC coding & marking inks market size is expected to grow at a CAGR of approximately 6.91% from 2024 to 2030.
The following factors are likely to contribute to the growth of the Asia-Pacific coding & marking inks market during the forecast period:
- Growing Application of Coding & Marking Inks Across Various End Users
- Stringent Regulatory Compliance & Increasing Need for Traceability
- Growing Demand for Flexible Packaging in the Region
Base Year: 2024
Forecast Year: 2025-2030
The report considers the present scenario of the Asia-Pacific coding & marking inks market and its market dynamics for 2025−2030. It covers a detailed overview of several market growth enablers, restraints, and trends. The study covers both the demand and supply sides of the market. It also profiles and analyzes leading companies and several other prominent companies operating in the market.
Key Company Profiles
- Hitachi Industrial Equipment Systems (HIES)
- Business Overview
- Product Offerings
- Key Developments
- Key Strategies
- Key Strengths
- Key Opportunities
- Domino Printing Sciences plc
- Videojet Technologies
- Kao Advanced Printing Solutions (APS)
- ITW Diagraph
- Control Print Limited
- Markem-Imaje
- Matthews Marking Systems
Other Prominent Company Profiles
- Anser Coding Inc.
- Business Overview
- Product Offerings
- Cyklop
- Linx Printing Technologies
- Leibinger Group
- Willita Ink Jet (Wuhan) Technology Co., Ltd/
- Zanasi
- Macsa ID
- Kishu Giken Kogyo Co., Ltd.
- UNITED BARCODE SYSTEMS (UBS)
- RN Mark Inc.
- Siegwerk Druckfarben AG & Co. KGaA
- Squid Ink
- Splashjet Inkjet Ink Private Limited
- MapleJet
- HSA Systems A/S
- Guangzhou EC-Pack Packaging Equipment Co., Ltd.
- Jet Inks Pvt. Ltd.
- Mylan Group
- Tronics
Segmentation by Product Type
- Solvent-based Inks
- Water-based Inks
- Oil-based Inks
- Other Inks
Segmentation by End-users
- Food & Beverage (F&Bs)
- Healthcare
- Electrical Equipment & Electronics (EE&E)
- Chemicals & Construction (C&C)
- Automotive & Aerospace (A&A)
- Other End-users
Segmentation by Technology
- Continuous Inkjet (CIJ)
- Thermal Inkjet (TIJ)
- Piezo Inkjet (PIJ)
- Valve Inkjet (VIJ)
Segmentation by Colorant
- Dyes
- Pigments
Segmentation by Geography
- APAC
- China
- Japan
- India
- Australia
- South Korea
- Indonesia
- Singapore
- Thailand
- Vietnam
- Malaysia
- Rest of APAC
APAC CODING AND MARKING INKS MARKET FAQs
How big is the Asia-Pacific coding & marking inks market?
What is the growth rate of the APAC coding & marking inks market?
What are the key drivers of the Asia-Pacific coding & marking inks market?
Who are the major players in the Asia-Pacific coding & marking inks market?
Which region dominates the Asia-Pacific coding & marking inks market?
For more details, please reach us at [email protected]
1. Scope & Coverage
- Market Definition
- Inclusions
- Exclusions
- Market Estimation Caveats
- Market Size & Forecast Periods
- Historic Period: 2021-2023
- Base Year: 2024
- Forecast Period: 2025-2030
- Market Size (2021-2030)
- Revenue
- Market Segments
- Market Segmentation by Product Type
- Market Segmentation by End-user
- Market Segmentation by coding & marking Technology
- Market Segmentation by Colorant
2. Opportunity Pockets
3. Introduction
- Impact of Tariff
4. Market Opportunities & Trends
- Shift toward Eco-friendly Inks and Sustainable Printing
- Technological Advancements & Ink Innovations in the Industry
- Rising Popularity of Tradeshows, Exhibitions, and Industry Events
5. Market Growth Enablers
- Growing Application of Coding & Marking Inks across Various End Users
- Growing Demand for Flexible Packaging in the Region
- Stringent Regulatory Compliance & Increasing Need for Traceability
6. Market Restraints
- High Cost of Coding & Marking Solutions
- Increasing Prominence of Laser Printing Technology
- Skilled Labor Shortage in the Coding & Marking Industry
7. Market Landscape
Five Forces Analysis
8. Product Type (Market Size & Forecast: 2021-2030)
- Solvent-based Inks
- Water-based Inks
- Oil-based Inks
- Other Inks
9. By End-users (Market Size & Forecast: 2021-2030)
- Food & Beverage (F&Bs)
- Healthcare
- Electrical Equipment & Electronics (EE&E)
- Chemicals & Construction (C&C)
- Automotive & Aerospace (A&A)
- Other End-users
10. Technology (Market Size & Forecast: 2021-2030)
- Continuous Inkjet (CIJ)
- Thermal Inkjet (TIJ)
- Piezo Inkjet (PIJ)
- Valve Inkjet (VIJ)
11. Colorant (Market Size & Forecast: 2021-2030)
- Dyes
- Pigments
12. Geography
- APAC
13. Competitive Landscape
14. Competitive Overview
15. Key Company Profiles
- Hitachi Industrial Equipment Systems (HIES)
- Domino Printing Sciences plc
- Videojet Technologies
- Kao Advanced Printing Solutions (APS)
- ITW Diagraph
- Control Print Limited
- Markem-Imaje
- Matthews Marking Systems
16. Other Prominent Company Profiles
- Anser Coding Inc.
- Cyklop
- Linx Printing Technologies
- Leibinger Group
- Willita Ink Jet (Wuhan) Technology Co., Ltd/
- Zanasi
- Macsa ID
- Kishu Giken Kogyo Co., Ltd.
- UNITED BARCODE SYSTEMS (UBS)
- RN Mark Inc.
- Siegwerk Druckfarben AG & Co. KGaA
- Squid Ink
- Splashjet Inkjet Ink Private Limited
- MapleJet
- HSA Systems A/S
- Guangzhou EC-Pack Packaging Equipment Co., Ltd.
- Jet Inks Pvt. Ltd.
- Mylan Group
- Tronics
17. Report Summary
- Key Takeaways
- Strategic Recommendations
Select a license type that suits your business needs
Single User Licence
- Report accessible by one user only
- Free 10% or 3 days of customization
- Free post-sale service assistance
- Continuous support through email
5 User Licence
- Report accessible by 5 users within the organization
- Free 15% or 4.5 days of customization
- Continuous support through email and telephone
- Free analyst hour
- Free Upgrade: If an updated report published within 180 days of purchase, you will get the revised report free of charge
Corporate Licence
- Free Datasheet worth $1500
- Report accessible by the entire organization
- Free 20% or 6 days of customization
- Free post-sale service assistance
- Continuous support through email and telephone
- Direct access to lead analysts
- Free analyst hour
- Free Upgrade: If an updated report published within 180 days of purchase, you will get the revised report free of charge
Datasheet Licence
- Report accessible by 1 user only
- Free 15% or 32 hours of customization
- Free post-sale service assistance
- Direct access to lead analysts
Frequently Asked Questions
How big is the Asia-Pacific coding & marking inks market?
What is the growth rate of the APAC coding & marking inks market?
What are the key drivers of the Asia-Pacific coding & marking inks market?
Who are the major players in the Asia-Pacific coding & marking inks market?
Which region dominates the Asia-Pacific coding & marking inks market?
Other RELATED Reports


