Data Center Liquid Cooling Market – Global Outlook & Forecast 2025-2030
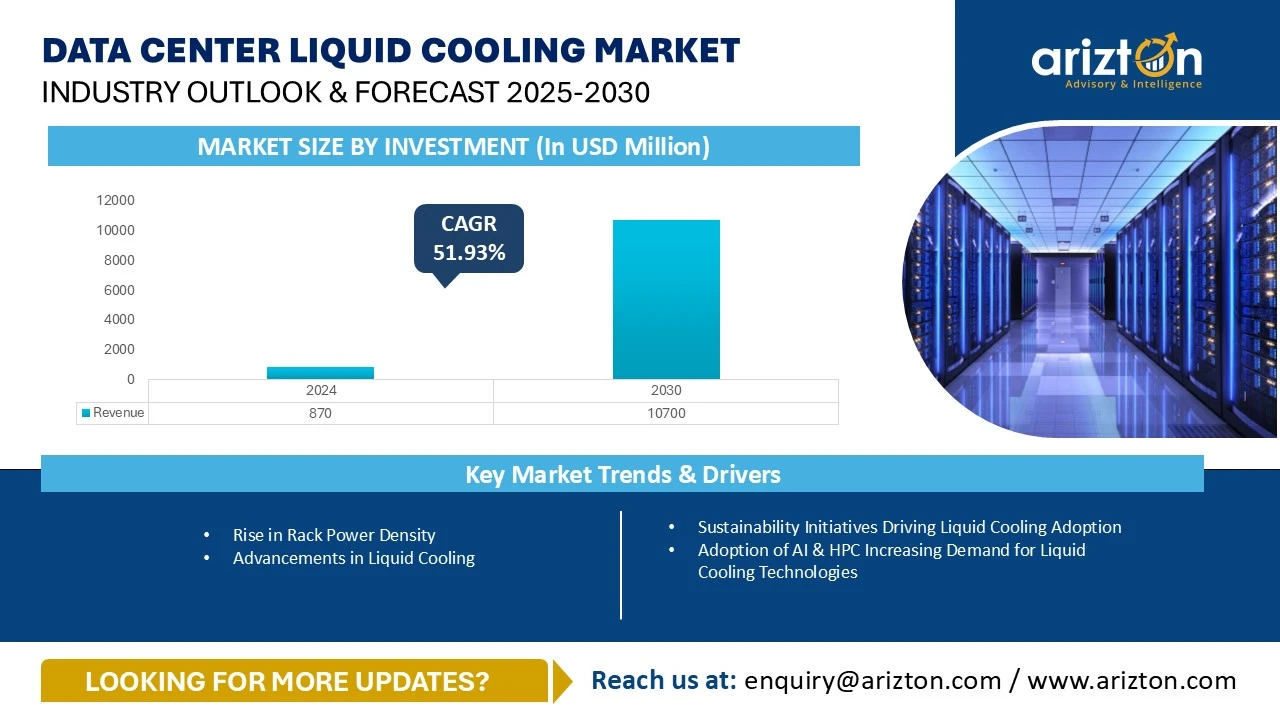
GLOBAL DATA CENTER LIQUID COOLING MARKET WAS VALUED AT USD 870 MILLION IN 2024, AND IS PROJECTED TO REACH 10.70 BILLION BY 2030, GROWING AT A CAGR OF 51.93%

356 pages
36 tables
105 charts
83 company
4 segments
5 region
21 countries
Purchase Options
Data Center Liquid Cooling Market – Global Outlook & Forecast 2025-2030
GLOBAL DATA CENTER LIQUID COOLING MARKET WAS VALUED AT USD 870 MILLION IN 2024, AND IS PROJECTED TO REACH 10.70 BILLION BY 2030, GROWING AT A CAGR OF 51.93%
The Data Center Liquid Cooling Market Size, Share, and Growth in Terms of
- Facility Type: Hyperscale Data Centers, Colocation Data Centers, and Enterprise Data Centers
- Cooling Type: Direct-to-Chip Liquid Cooling and Immersion Cooling
- Cooling Components: Coolant Distribution Units (CDUs), Rear Door Heat Exchangers (RDHx), Coolants & Fluids, and Other Components
- Geography: North America, Latin America, Europe, APAC, and Middle East
Industry Analysis Report, Regional Outlook, Growth Potential, Price Trends, Competitive Market Share & Forecast 2025–2030.
This report includes market data points, ranging from trend
analyses to market estimates & forecasts that you can customize
GLOBAL DATA CENTER LIQUID COOLING MARKET REPORT SCOPE
| REPORT ATTRIBUTE | DETAILS |
|---|---|
| MARKET SIZE BY INVESTMENT 2030 | USD 10.70 Billion |
| MARKET SIZE BY INVESTMENT 2024 | USD 870 Million |
| CAGR - INVESTMENT (2024-2030) | 51.93% |
| HISTORIC YEAR | 2021-2023 |
| BASE YEAR | 2024 |
| FORECAST YEAR | 2025-2030 |
| MARKET SEGMENTS | Facility Type, Cooling Type, Cooling Components, and Geography |
| GEOGRAPHICAL ANALYSIS | North America, Latin America, Europe, APAC, and Middle East |
DATA CENTER LIQUID COOLING MARKET SIZE ANALYSIS
The global data center liquid cooling market size by investment was valued at USD 870 million in 2024 and is projected to reach USD 10.70 billion by 2030, growing at a CAGR of 51.93% during the forecast period. The rapid expansion of AI, HPC, and supercomputing workloads is significantly increasing server chip power consumption, making traditional data center cooling market solutions based on air cooling increasingly inefficient and costly.
In high-performance servers, fans can consume 10%–20% of total system power, while thermal losses increase as chips operate near maximum temperatures. The use of larger heat sinks, higher airflow, and wider spacing between components further limits rack density, driving demand for liquid cooling for data centers.
In 2025, the data center liquid cooling market growth is expected to accelerate sharply, with investment and power capacity increasing by over 151% and 135%, respectively. By 2030, the global data center liquid cooling market is anticipated to consolidate and stabilize, with annual growth moderating to approximately 13–15%.
Technologies such as direct liquid cooling data centers and immersion cooling data centers are increasingly recognized as the most effective approaches for improving energy efficiency and sustainability. By enabling higher chilled-water temperatures and year-round free cooling, liquid cooling infrastructure for data centers also supports waste heat reuse and lower operational emissions.
Global hyperscalers—including Apple, Google, Meta, Microsoft, and AWS—are playing a decisive role in accelerating investments in hyperscale data center cooling. The deployment of ultra-dense GPUs and high-density racks has made high-density data center cooling solutions such as cold plate liquid cooling and immersion cooling essential, as air cooling technologies can no longer manage thermal loads reliably.
DATA CENTER LIQUID COOLING MARKET KEY HIGHLIGHTS
- Liquid cooling solutions are becoming essential in the data center liquid cooling industry due to rising rack power densities and AI-driven workloads.
- The data center liquid cooling market is projected to witness an absolute growth of over 1,129% between 2024 and 2030.
- In 2024, direct liquid cooling data centers accounted for the largest share of total investments, while immersion cooling data centers represented approximately 17%, playing a critical role in AI-ready facilities.
- Hyperscale facilities dominated the data center liquid cooling market size in 2024, while colocation facilities accounted for roughly 36% of investments.
- The US and China lead adoption, while regions with high electricity costs—such as the Middle East and Latin America—are increasingly investing in liquid cooling for data centers to reduce energy consumption.
- High upfront integration costs and supply-chain challenges remain key barriers in the data center cooling market.
DATA CENTER LIQUID COOLING MARKET TRENDS & DRIVERS
Rise in Rack Power Density
The steady increase in rack power density is reshaping data center design and accelerating adoption of rack-based liquid cooling systems. AI, GPU clusters, and HPC workloads generate heat loads that exceed the limits of traditional air-based data center cooling market solutions.
Cold plate liquid cooling, immersion cooling, and rear door heat exchanger systems offer superior thermal management, improved rack utilization, and reduced energy consumption, reinforcing key data center liquid cooling market trends.
Advancements in Liquid Cooling Technologies
Modern liquid cooling infrastructure for data centers brings cooling closer to heat-generating components. In immersion cooling, servers are submerged in dielectric fluids, while direct-to-chip cooling circulates liquid through cold plates attached to CPUs and GPUs, enabling efficient heat removal and improved system reliability.
Sustainability Initiatives Driving Adoption
As operators pursue net-zero and energy-efficiency targets, liquid cooling for data centers has emerged as a preferred solution. Compared to air cooling, liquid cooling reduces power usage, supports higher rack density, and lowers carbon emissions, making it a core pillar of sustainable data center liquid cooling market growth.
DATA CENTER LIQUID COOLING MARKET SEGMENTATION INSIGHTS
- The adoption of liquid cooling varies across hyperscale, colocation, and enterprise data centers based on their operational scale and workload intensity. Hyperscale data centers are at present the largest adopters of liquid cooling, driven by their need to support HPC and AI workloads that demand massive power capacities exceeding 100 MW. The hyperscale companies such as AWS, Microsoft, Google, and Meta continue to invest heavily in direct-to-chip and immersion cooling technologies to enhance efficiency and sustainability.
- Colocation data centers are rapidly transitioning to liquid cooling as enterprise clients deploy GPU clusters and AI infrastructure within these facilities. Liquid cooling helps colocation providers maintain high rack densities while meeting customer sustainability goals.
- Enterprise data centers, though slower to adopt, are beginning to integrate liquid cooling to handle growing AI and edge workloads, especially in financial, healthcare, and research industries. As hardware densities increase, enterprises are expected to move toward hybrid cooling systems combining liquid and air-based methods.
- Direct-to-chip cooling dominates current deployments due to its compatibility with existing rack architectures and efficient heat removal at the processor level. It enables improved performance, reduces fan usage, and better PUE. Meanwhile, immersion cooling is gaining rapid momentum, particularly in facilities supporting AI training, HPC, and large-scale GPU deployments. This method, which submerges servers in dielectric fluids, allows extreme rack densities and reduces mechanical cooling needs. In the coming years, DLC and immersion cooling are expected to witness faster growth as hyperscalers, and colocation operators build new AI-optimized campuses designed specifically for these technologies.
- Rear door heat exchangers continue to play an important role in data center facilities, as they efficiently remove heat at the rack level without major infrastructure changes.
- Coolant distribution units are becoming critical for managing and circulating liquid flow between IT equipment and heat rejection systems, ensuring stable thermal performance.
- Coolants and fluids are a vital part of the cooling mechanism that witnesses growing demand for non-conductive, environmentally safe, and long-lasting liquids that can operate efficiently in high-temperature conditions.
- The other components, including cold plates, control systems, and piping networks, continue to evolve with smart monitoring features that help optimize fluid flow and temperature in real time.
DATA CENTER LIQUID COOLING MARKET GEOGRAPHICAL ANALYSIS
North America, led by the US, dominates the global data center liquid cooling market. North America leads the data center liquid cooling market, driven by strong adoption in the US as operators invest in direct liquid cooling and immersion cooling to support AI and high-density workloads. Canada remains in a growth phase, with adoption expected to rise significantly over the next three years. In Latin America, Brazil is the primary growth market, while other countries show gradual uptake.
In Europe, countries such as the UK, Germany, and France are witnessing strong growth in liquid cooling for data centers, supported by energy-efficiency regulations and AI infrastructure expansion. Nordic countries, including Norway and Sweden, are also increasing investments, while broader European adoption is expected to accelerate over the next three to five years.
In APAC, China dominates the data center liquid cooling industry, with advanced deployments of direct-to-chip and immersion cooling technologies. Adoption in Japan, India, Australia, and South Korea is accelerating, while other regional markets remain at an early stage.
In the Middle East, the UAE and Saudi Arabia lead adoption due to extreme climate conditions and hyperscale investments. Other countries in the region are expected to see gradual growth over the next three to five years.
DATA CENTER LIQUID COOLING MARKET VENDOR LANDSCAPE
The data center liquid cooling market remains highly competitive, with global and regional vendors offering solutions such as direct-to-chip cooling, immersion cooling, rear door heat exchangers, and coolant distribution units. Vendors are strongly focused on innovation, energy efficiency, and sustainability to meet rising thermal demands driven by AI, cloud computing, and HPC workloads.
Companies including Asetek, Submer, CoolIT Systems, Iceotope, and LiquidStack lead in immersion and direct liquid cooling solutions for hyperscale, colocation, and enterprise data centers, emphasizing modular designs that support high rack densities and optimal PUE. At the same time, major infrastructure players such as Vertiv, Schneider Electric, STULZ, Alfa Laval, and Johnson Controls are expanding their liquid cooling portfolios to strengthen end-to-end thermal management offerings.
Specialty providers like Boyd, Castrol, Dow, and Lubrizol are advancing high-performance coolants and thermal materials, while equipment manufacturers such as Delta Electronics and Ebm-papst focus on efficient pumps and control systems. Strategic collaborations between IT vendors, including Dell Technologies, HPE, Lenovo, and NVIDIA and liquid cooling providers are accelerating the adoption of liquid-ready server architectures.
Going forward, market differentiation will depend on vendors’ ability to deliver scalable, high-efficiency, and environmentally sustainable cooling solutions aligned with net-zero and green data center goals. Industry consolidation is also increasing, highlighted by Eaton’s acquisition of Boyd Thermal in November 2025, strengthening its position in the liquid cooling ecosystem.
SNAPSHOT
The global data center liquid cooling market by investment is projected to reach USD 10.70 billion by 2030, growing at a CAGR of 19.77% from 2024 to 2030.
The following factor are likely to contribute to the growth of the global data center liquid cooling market during the forecast period:
- Sustainability Initiatives Driving Liquid Cooling Adoption
- Adoption of AI & HPC Increasing Demand for Liquid Cooling Technologies
- GPU-as-a-Service Providers Driving Adoption of Liquid Cooling Technologies
Base Year: 2024
Forecast Year: 2025-2030
The report considers the present scenario of the global data center liquid cooling market and its market dynamics for 2025−2030. It covers a detailed overview of several market growth enablers, restraints, and trends. The study includes the demand and supply aspects of the global data center liquid cooling market.
Liquid Cooling Infrastructure Providers
- 3M
- Business Overview
- Product Offerings
- ABB
- Accelsius
- Airedale by Modine
- AIRSYS
- Alfa Laval
- Aqua Cooling
- Asetek
- Asperitas
- Baltimore Aircoil Company (BAC)
- Belimo
- Boyd
- Canovate
- Carrier
- Castrol
- CITEC International
- ClimateWorx International
- Coolcentric
- Cooler Master
- CoolIT Systems
- Curtiss-Wright
- Daikin Applied
- Danfoss
- DCX Liquid Cooling Systems
- Dell Technologies
- Delta Electronics
- Dow
- Dug
- ebm-papst
- EMICON
- ENGIE Refrigeration
- Envicool
- EVAPCO
- ExxonMobil
- FläktGroup
- Flex
- Flowserve
- Fourier Cooling
- Fujitsu
- GIGABYTE
- Green Revolution Cooling (GRC)
- Guntner
- Hewlett Packard Enterprise
- HiRef S.p.A
- Hitachi
- Huawei Technologies
- IBM
- Iceotope
- Inspur
- Johnson Controls
- Kaori Heat Treatment
- Kelvion
- Koolance
- KSTAR
- Legrand
- Lenovo
- LiquidCool Solutions
- LiquidStack
- Midas Immersion Cooling
- Mikros Technologies
- Mitsubishi Electric
- Moog
- Motivair
- Munters
- Nidec Corporation
- Nortek Data Center Cooling
- nVent
- OptiCool Technologies
- Renovo Zhuhai
- Shanghai Shenglin M&E Technology
- SMC
- SPX Technologies
- Stellar Energy
- STULZ
- Submer
- Supermicro
- Swegon
- The Lubrizol Corporation
- Trane
- Valvoline
- Vertiv
- Wakefield Thermal
- ZutaCore
Segmentation by Facility Type
- Hyperscale Data Centers
- Colocation Data Centers
- Enterprise Data Centers
Segmentation by Cooling Type
- Direct-to-Chip Liquid Cooling
- Immersion Cooling
Segmentation by Cooling Components
- Coolant Distribution Units (CDUs)
- Rear Door Heat Exchangers (RDHx)
- Coolants & Fluids, and Other Components
Segmentation by Geography
- North America
- US
- CANADA
- Latin America
- BRAZIL
- Europe
- UK
- GERMANY
- FRANCE
- IRELAND
- SPAIN
- SWEDEN
- NORWAY
- FINLAND
- ICELAND
- OTHER EUROPEAN COUNTIRES
- APAC
- CHINA
- INDIA
- AUSTRALIA
- SOUTH KOREA
- MALAYSIA
- THAILAND
- Middle East
- SAUDI ARABIA
- UAE
DATA CENTER LIQUID COOLING MARKET FAQs
What is the growth rate of the global data center liquid cooling market?
How big is the global data center liquid cooling market?
What are the key trends in the global data center liquid cooling market?
- Exhibit 1: Market Derivation
- Exhibit 2: Global Data Center Liquid Cooling Market Overview
- Exhibit 3: Impact of Key Opportunities & Trends 2024 & 2030
- Exhibit 4: Comparison of Different Types of Cooling Technologies along with Rack Power Densities
- Exhibit 5: Impact of Key Growth Enablers 2024 & 2030
- Exhibit 6: Impact of Key Restraints 2024 & 2030
- Exhibit 7: Data Center Liquid Cooling Market by Facility Type ($ million)
- Exhibit 8: Data Center Liquid Cooling Market by Cooling Type ($ million)
- Exhibit 9: Data Center Liquid Cooling Market by Cooling Components ($ million)
- Exhibit 10: Data Center Liquid Cooling Market by Investment 2024-2030 ($ million)
- Exhibit 11: Data Center Liquid Cooling Market by Power Capacity 2024-2030 (MW)
- Exhibit 12: Hyperscale Data Center Liquid Cooling Market by Investment 2024-2030 ($ million)
- Exhibit 13: Hyperscale Data Center Liquid Cooling Market by Power Capacity 2024-2030 (MW)
- Exhibit 14: Colocation Data Center Liquid Cooling Market by Investment 2024-2030 ($ million)
- Exhibit 15: Colocation Data Center Liquid Cooling Market by Power Capacity 2024-2030 (MW)
- Exhibit 16: Enterprise Data Center Liquid Cooling Market by Investment 2024-2030 ($ million)
- Exhibit 17: Enterprise Data Center Liquid Cooling Market by Power Capacity 2024-2030 (MW)
- Exhibit 18: Market Snapshot: Immersion Cooling - Technology Types
- Exhibit 19: Cumulative Investments by Cooling Types (2025-2030)
- Exhibit 20: Data Center Liquid Cooling Market by Direct-to-Chip Cooling Technique 2024–2030 ($ million)
- Exhibit 21: Data Center Liquid Cooling Market by Liquid Immersion Cooling 2024–2030 ($ million)
- Exhibit 22: Data Center Liquid Cooling Market by Coolant Distribution Units 2024–2030 ($ million)
- Exhibit 23: Data Center Liquid Cooling Market by RDHx 2024–2030 ($ million)
- Exhibit 24: Data Center Liquid Cooling Market by Coolants & Fluids 2024–2030 ($ million)
- Exhibit 25: Data Center Liquid Cooling Market by Other Components 2024–2030 ($ million)
- Exhibit 26: North America Data Center Liquid Cooling Market Overview
- Exhibit 27: North America Data Center Liquid Cooling Market by Investment 2024–2030 ($ million)
- Exhibit 28: North America Data Center Liquid Cooling Market by Power Capacity 2024–2030 (MW)
- Exhibit 29: US Data Center Liquid Cooling Market Overview
- Exhibit 30: US Data Center Liquid Cooling Market by Investment 2024–2030 ($ million)
- Exhibit 31: US Data Center Liquid Cooling Market by Power Capacity 2024–2030 (MW)
- Exhibit 32: Canada Data Center Liquid Cooling Market Overview
- Exhibit 33: Canada Data Center Liquid Cooling Market by Investment 2024-2030 ($ million)
- Exhibit 34: Canada Data Center Liquid Cooling Market by Power Capacity 2024–2030 (MW)
- Exhibit 35: Latin America Data Center Liquid Cooling Market Overview
- Exhibit 36: Latin America Data Center Liquid Cooling Market by Investment 2024–2030 ($ million)
- Exhibit 37: Latin America Data Center Liquid Cooling Market by Power Capacity 2024–2030 (MW)
- Exhibit 38: Brazil Data Center Liquid Cooling Market Overview
- Exhibit 39: Brazil Data Center Liquid Cooling Market by Investment 2024-2030 ($ million)
- Exhibit 40: Brazil Data Center Liquid Cooling Market by Power Capacity 2024–2030 (MW)
- Exhibit 41: Europe Data Center Liquid Cooling Market Overview
- Exhibit 42: Europe Data Center Liquid Cooling Market by Investment 2024-2030 ($ million)
- Exhibit 43: Europe Data Center Liquid Cooling Market by Power Capacity 2024–2030 (MW)
- Exhibit 44: UK Data Center Liquid Cooling Market Overview
- Exhibit 45: UK Data Center Liquid Cooling Market by Investment 2024-2030 ($ million)
- Exhibit 46: UK Data Center Liquid Cooling Market by Power Capacity 2024–2030 (MW)
- Exhibit 47: Germany Data Center Liquid Cooling Market Overview
- Exhibit 48: Germany Data Center Liquid Cooling Market by Investment 2024-2030 ($ million)
- Exhibit 49: Germany Data Center Liquid Cooling Market by Power Capacity 2024–2030 (MW)
- Exhibit 50: France Data Center Liquid Cooling Market Overview
- Exhibit 51: France Data Center Liquid Cooling Market by Investment 2024-2030 ($ million)
- Exhibit 52: France Data Center Liquid Cooling Market by Power Capacity 2024–2030 (MW)
- Exhibit 53: Ireland Data Center Liquid Cooling Market Overview
- Exhibit 54: Ireland Data Center Liquid Cooling Market by Investment 2024–2030 ($ million)
- Exhibit 55: Ireland Data Center Liquid Cooling Market by Power Capacity 2024–2030 (MW)
- Exhibit 56: Spain Data Center Liquid Cooling Market Overview
- Exhibit 57: Spain Data Center Liquid Cooling Market by Investment 2024-2030 ($ million)
- Exhibit 58: Spain Data Center Liquid Cooling Market by Power Capacity 2024–2030 (MW)
- Exhibit 59: Sweden Data Center Liquid Cooling Market Overview
- Exhibit 60: Sweden Data Center Liquid Cooling Market by Investment 2024–2030 ($ million)
- Exhibit 61: Sweden Data Center Liquid Cooling Market by Power Capacity 2024–2030 (MW)
- Exhibit 62: Norway Data Center Liquid Cooling Market –Overview
- Exhibit 63: Norway Data Center Liquid Cooling Market by Investment 2024–2030 ($ million)
- Exhibit 64: Norway Data Center Liquid Cooling Market by Power Capacity 2024–2030 (MW)
- Exhibit 65: Finland Data Center Liquid Cooling Market – Overview
- Exhibit 66: Finland Data Center Liquid Cooling Market by Investment 2024–2030 ($ million)
- Exhibit 67: Finland Data Center Liquid Cooling Market by Power Capacity 2024–2030 (MW)
- Exhibit 68: Iceland Data Center Liquid Cooling Market Overview
- Exhibit 69: Iceland Data Center Liquid Cooling Market by Investment 2024-2030 ($ million)
- Exhibit 70: Iceland Data Center Liquid Cooling Market by Power Capacity 2024–2030 (MW)
- Exhibit 71: Other European Countries Data Center Liquid Cooling Market Overview
- Exhibit 72: Other European Countries Data Center Liquid Cooling Market by Investment 2024–2030 ($ million)
- Exhibit 73: Other European Countries Data Center Liquid Cooling Market by Power Capacity 2024–2030 (MW)
- Exhibit 74: APAC Data Center Liquid Cooling Market – Overview
- Exhibit 75: APAC Data Center Liquid Cooling Market by Investment 2024–2030 ($ million)
- Exhibit 76: APAC Data Center Liquid Cooling Market by Power Capacity 2024–2030 (MW)
- Exhibit 77: China Data Center Liquid Cooling Market – Overview
- Exhibit 78: China Data Center Liquid Cooling Market by Investment 2024–2030 ($ million)
- Exhibit 79: China Data Center Liquid Cooling Market by Power Capacity 2024–2030 (MW)
- Exhibit 80: India Data Center Liquid Cooling Market – Overview
- Exhibit 81: India Data Center Liquid Cooling Market by Investment 2024–2030 ($ million)
- Exhibit 82: India Data Center Liquid Cooling Market by Power Capacity 2024–2030 (MW)
- Exhibit 83: Australia Data Center Liquid Cooling Market – Overview
- Exhibit 84: Australia Data Center Liquid Cooling Market by Investment 2024–2030 ($ million)
- Exhibit 85: Australia Data Center Liquid Cooling Market by Power Capacity 2024–2030 (MW)
- Exhibit 86: South Korea Data Center Liquid Cooling Market – Overview
- Exhibit 87: South Korea Data Center Liquid Cooling Market by Investment 2024–2030 ($ million)
- Exhibit 88: South Korea Data Center Liquid Cooling Market by Power Capacity 2024–2030 (MW)
- Exhibit 89: Malaysia Data Center Liquid Cooling Market – Overview
- Exhibit 90: Malaysia Data Center Liquid Cooling Market by Investment 2024–2030 ($ million)
- Exhibit 91: Malaysia Data Center Liquid Cooling Market by Power Capacity 2024–2030 (MW)
- Exhibit 92: Thailand Data Center Liquid Cooling Market – Overview
- Exhibit 93: Thailand Data Center Liquid Cooling Market by Investment 2024–2030 ($ million)
- Exhibit 94: Thailand Data Center Liquid Cooling Market by Power Capacity 2024–2030 (MW)
- Exhibit 95: Middle East Data Center Liquid Cooling Market – Overview
- Exhibit 96: Middle East Data Center Liquid Cooling Market by Investment 2024–2030 ($ million)
- Exhibit 97: Middle East Data Center Liquid Cooling Market by Power Capacity 2024–2030 (MW)
- Exhibit 98: UAE Data Center Liquid Cooling Market – Overview
- Exhibit 99: UAE Data Center Liquid Cooling Market by Investment 2024–2030 ($ million)
- Exhibit 100: UAE Data Center Liquid Cooling Market by Power Capacity 2024–2030 (MW)
- Exhibit 101: Saudi Arabia Data Center Liquid Cooling Market – Overview
- Exhibit 102: Saudi Arabia Data Center Liquid Cooling Market by Investment 2024–2030 ($ million)
- Exhibit 103: Saudi Arabia Data Center Liquid Cooling Market by Power Capacity 2024–2030 (MW)
- Exhibit 104: Direct Liquid Cooling Market –Vendor Share Analysis (2024)
- Exhibit 105: Immersion Cooling Market – Vendor Share Analysis (2024)
LIST OF TABLES
- Table 1: Comparison at High Densities
- Table 2: CAPEX Comparison (Per Rack, Typical Values)
- Table 3: Global Data Center Liquid Cooling Market 2024–2030
- Table 4: Data Center Liquid Cooling Market by Facility Type Investment 2024–2030 ($ million)
- Table 5: Data Center Liquid Cooling Market by Facility Type Power Capacity 2024–2030 (MW)
- Table 6: Data Center Liquid Cooling Market by Cooling Type 2024–2030 ($ million)
- Table 7: Data Center Liquid Cooling Market by Components 2024–2030 ($ million)
- Table 8: Data Center Liquid Cooling Market by Geography Investment 2024–2030 ($ million)
- Table 9: Data Center Liquid Cooling Market by Power Capacity 2024–2030 (MW)
- Table 10: North America Data Center Liquid Cooling Market 2024–2030
- Table 11: US Data Center Liquid Cooling Market 2024–2030
- Table 12: Canada Data Center Liquid Cooling Market 2024–2030
- Table 13: Latin America Data Center Liquid Cooling Market 2024–2030
- Table 14: Brazil Data Center Liquid Cooling Market 2024–2030
- Table 15: Europe Data Center Liquid Cooling Market 2024–2030
- Table 16: UK Data Center Liquid Cooling Market 2024–2030
- Table 17: Germany Data Center Liquid Cooling Market 2024–2030
- Table 18: France Data Center Liquid Cooling Market 2024–2030
- Table 19: Ireland Data Center Liquid Cooling Market 2024–2030
- Table 20: Spain Data Center Liquid Cooling Market 2024–2030
- Table 21: Sweden Data Center Liquid Cooling Market 2024–2030
- Table 22: Norway Data Center Liquid Cooling Market 2024–2030
- Table 23: Finland Data Center Liquid Cooling Market 2024–2030
- Table 24: Iceland Data Center Liquid Cooling Market 2024–2030
- Table 25: Other European Countries Data Center Liquid Cooling Market 2024-2030
- Table 26: APAC Data Center Liquid Cooling Market 2024–2030
- Table 27: China Data Center Liquid Cooling Market 2024–2030
- Table 28: India Data Center Liquid Cooling Market 2024–2030
- Table 29: Australia Data Center Liquid Cooling Market 2024–2030
- Table 30: South Korea Data Center Liquid Cooling Market 2024–2030
- Table 31: Malaysia Data Center Liquid Cooling Market 2024–2030
- Table 32: Thailand Data Center Liquid Cooling Market 2024–2030
- Table 33: Middle East Data Center Liquid Cooling Market 2024–2030
- Table 34: UAE Data Center Liquid Cooling Market 2024–2030
- Table 35: Saudi Arabia Data Center Liquid Cooling Market 2024–2030
- Table 36: Currency Conversion Table (2016-2023)
1. REPORT COVERAGE
- 1.1. WHAT’S INCLUDED
- 1.2. SEGMENTAL COVERAGE
- 1.2.1. Market Segmentation by Facility Type
- 1.2.2. Market Segmentation by Cooling Technologies
- 1.2.3. Market Segmentation by Cooling Components
2. RESEARCH METHODOLOGY
3. MARKET AT A GLANCE
4. INTRODUCTION
- 4.1. WORLDWIDE DATA CENTER MARKET LANDSCAPE
- 4.1.1. Worldwide Data Center Market Scenario
- 4.1.2. Worldwide Data Center Market Competitive Analysis
- 4.1.3. Worldwide Data Center Liquid Cooling Market Scenario
- 4.1.4. Worldwide Data Center Liquid Cooling Market Competitive Analysis
4.2. MARKET OVERVIEW
4.3. COMMON DATA CENTER DESIGN STANDARDS
4.4. DATA CENTER CONSTRUCTION COSTS
5. PREMIUM INSIGHTS
- 5.1. MARKET OVERVIEW
- 5.2. KEY HIGHLIGHTS
- 5.3. SEGMENTAL ANALYSIS
- 5.4. GEOGRAPHICAL ANALYSIS
- 5.5. VENDOR ANALYSIS
6. MARKET OPPORTUNITIES & TRENDS
- 6.1. RISE IN RACK POWER DENSITY
- 6.2. ADVANCEMENTS IN LIQUID COOLING
- 6.2.1. Direct-to-Chip (D2C) Cold Plate Cooling
- 6.2.2. Single-Phase Immersion Cooling
- 6.2.3. Two-Phase Immersion Cooling
- 6.2.4. Advanced Coolant Distribution Units (CDUs)
- 6.2.5. Rear-Door Heat Exchangers (RDHx)
- 6.2.6. Software & Controls Integration
- 6.2.7. Sustainable Cooling Innovations
7. MARKET GROWTH ENABLERS
- 7.1. SUSTAINABILITY INITIATIVES DRIVING LIQUID COOLING ADOPTION
- 7.2. ADOPTION OF AI & HPC INCREASING DEMAND FOR LIQUID COOLING TECHNOLOGIES
- 7.3. GPU-AS-A-SERVICE PROVIDERS DRIVING ADOPTION OF LIQUID COOLING TECHNOLOGIES
8. MARKET RESTRAINTS
- 8.1. SUPPLY CHAIN DISRUPTIONS HAMPER MARKET GROWTH
- 8.2. EXPENSIVE COST OF LIQUID COOLING INFRASTRUCTURE INSTALLATION
9. MARKET LANDSCAPE
- 9.1. MARKET OVERVIEW
- 9.2. INVESTMENT: MARKET SIZE & FORECAST
- 9.3. POWER CAPACITY: MARKET SIZE & FORECAST
10. FACILITY TYPE
- 10.1. HYPERSCALE DATA CENTERS
- 10.1.1. Market Overview
- 10.1.2. Investment: Market Size & Forecast
- 10.1.3. Power Capacity: Market Size & Forecast
- 10.2. COLOCATION DATA CENTERS
- 10.2.1. Market Overview
- 10.2.2. Investment: Market Size & Forecast
- 10.2.3. Power Capacity: Market Size & Forecast
- 10.3. ENTERPRISE DATA CENTERS
- 10.3.1. Market Overview
- 10.3.2. Investment: Market Size & Forecast
- 10.3.3. Power Capacity: Market Size & Forecast
11. COOLING TYPES
- 11.1. MARKET SNAPSHOT
- 11.2. MARKET OVERVIEW
- 11.3. DIRECT-TO-CHIP LIQUID COOLING TECHNIQUE
- 11.3.1. Market Overview
- 11.3.2. Investment: Market Size & Forecast
- 11.4. LIQUID IMMERSION COOLING
- 11.4.1. Market Overview
- 11.4.2. Investment: Market Size & Forecast
12. COOLING COMPONENTS
- 12.1. COOLANT DISTRIBUTION UNITS
- 12.1.1. Market Overview
- 12.1.2. Investment: Market Size & Forecast
- 12.2. REAR DOOR HEAT EXCHANGERS
- 12.2.1. Market Overview
- 12.2.2. Investment: Market Size & Forecast
- 12.3. COOLANTS & FLUIDS
- 12.3.1. Market Overview
- 12.3.2. Investment: Market Size & Forecast
- 12.4. OTHER COMPONENTS
- 12.4.1. Market Overview
- 12.4.2. Investment: Market Size & Forecast
13. NORTH AMERICA
- 13.1. Market Overview
- 13.2. Investment: Market Size & Forecast
- 13.3. Power Capacity: Market Size & Forecast
- 13.4. US
- 13.4.1. Market Overview
- 13.4.2. Investment: Market Size & Forecast
- 13.4.3. Power Capacity: Market Size & Forecast
- 13.5. CANADA
- 13.5.1. Market Overview
- 13.5.2. Investment: Market Size & Forecast
- 13.5.3. Power Capacity: Market Size & Forecast
14. LATIN AMERICA
- 14.1. Market Overview
- 14.2. Investment: Market Size & Forecast
- 14.3. Power Capacity: Market Size & Forecast
- 14.4. BRAZIL
- 14.4.1. Market Overview
- 14.4.2. Investment: Market Size & Forecast
- 14.4.3. Power Capacity: Market Size & Forecast
15. EUROPE
- 15.1. Market Overview
- 15.2. Investment: Market Size & Forecast
- 15.3. Power Capacity: Market Size & Forecast
- 15.4. UK
- 15.4.1. Market Overview
- 15.4.2. Investment: Market Size & Forecast
- 15.4.3. Power Capacity: Market Size & Forecast
- 15.5. GERMANY
- 15.5.1. Market Overview
- 15.5.2. Investment: Market Size & Forecast
- 15.5.3. Power Capacity: Market Size & Forecast
- 15.6. FRANCE
- 15.6.1. Market Overview
- 15.6.2. Investment: Market Size & Forecast
- 15.6.3. Power Capacity: Market Size & Forecast
- 15.7. IRELAND
- 15.7.1. Market Overview
- 15.7.2. Investment: Market Size & Forecast
- 15.7.3. Power Capacity: Market Size & Forecast
- 15.8. SPAIN
- 15.8.1. Market Overview
- 15.8.2. Investment: Market Size & Forecast
- 15.8.3. Power Capacity: Market Size & Forecast
- 15.9. SWEDEN
- 15.9.1. Market Overview
- 15.9.2. Investment: Market Size & Forecast
- 15.9.3. Power Capacity: Market Size & Forecast
- 15.10. NORWAY
- 15.10.1. Market Overview
- 15.10.2. Investment: Market Size & Forecast
- 15.10.3. Power Capacity: Market Size & Forecast
- 15.11. FINLAND
- 15.11.1. Market Overview
- 15.11.2. Investment: Market Size & Forecast
- 15.11.3. Power Capacity: Market Size & Forecast
- 15.12. ICELAND
- 15.12.1. Market Overview
- 15.12.2. Investment: Market Size & Forecast
- 15.12.3. Power Capacity: Market Size & Forecast
- 15.13. OTHER EUROPEAN COUNTRIES
- 15.13.1. Market Overview
- 15.13.2. Investment: Market Size & Forecast
- 15.13.3. Power Capacity: Market Size & Forecast
16. APAC
- 16.1. Market Overview
- 16.2. Investment: Market Size & Forecast
- 16.3. Power Capacity: Market Size & Forecast
- 16.4. CHINA
- 16.4.1. Market Overview
- 16.4.2. Investment: Market Size & Forecast
- 16.4.3. Power Capacity: Market Size & Forecast
- 16.5. INDIA
- 16.5.1. Market Overview
- 16.5.2. Investment: Market Size & Forecast
- 16.5.3. Power Capacity: Market Size & Forecast
- 16.6. AUSTRALIA
- 16.6.1. Market Overview
- 16.6.2. Investment: Market Size & Forecast
- 16.6.3. Power Capacity: Market Size & Forecast
- 16.7. SOUTH KOREA
- 16.7.1. Market Overview
- 16.7.2. Investment: Market Size & Forecast
- 16.7.3. Power Capacity: Market Size & Forecast
- 16.8. MALAYSIA
- 16.8.1. Market Overview
- 16.8.2. Investment: Market Size & Forecast
- 16.8.3. Power Capacity: Market Size & Forecast
- 16.9. THAILAND
- 16.9.1. Market Overview
- 16.9.2. Investment: Market Size & Forecast
- 16.9.3. Power Capacity: Market Size & Forecast
17. MIDDLE EAST
- 17.1. Market Overview
- 17.2. Investment: Market Size & Forecast
- 17.3. Power Capacity: Market Size & Forecast
- 17.4. UAE
- 17.4.1. Market Overview
- 17.4.2. Investment: Market Size & Forecast
- 17.4.3. Power Capacity: Market Size & Forecast
- 17.5. SAUDI ARABIA
- 17.5.1. Market Overview
- 17.5.2. Investment: Market Size & Forecast
- 17.5.3. Power Capacity: Market Size & Forecast
18. COMPETITIVE LANDSCAPE
- 18.1. DATA CENTER DIRECT LIQUID COOLING MARKET-MARKET SHARE ANALYSIS
- 18.2. DATA CENTER IMMERSION COOLING MARKET – MARKET SHARE ANALYSIS
19. KEY LIQUID COOLING INFRASTRUCTURE PROVIDERS
- 19.1. 3M
- 19.1.1. Business Overview
- 19.1.2. Product Offerings
- 19.2. ABB
- 19.2.1. Business Overview
- 19.2.2. Product Offerings
- 19.3. ACCELSIUS
- 19.3.1. Business Overview
- 19.3.2. Product Offerings
- 19.4. AIREDALE BY MODINE
- 19.4.1. Business Overview
- 19.4.2. Product Offerings
- 19.5. AIRSYS
- 19.5.1. Business Overview
- 19.5.2. Product Offerings
- 19.6. ALFA LAVAL
- 19.6.1. Business Overview
- 19.6.2. Product Offerings
- 19.7. AQUA COOLING
- 19.7.1. Business Overview
- 19.7.2. Product Offerings
- 19.8. ASETEK
- 19.8.1. Business Overview
- 19.8.2. Product Offerings
- 19.9. ASPERITAS
- 19.9.1. Business Overview
- 19.9.2. Product Offerings
- 19.10. BALTIMORE AIRCOIL COMPANY
- 19.10.1. Business Overview
- 19.10.2. Product Offerings
- 19.11. BELIMO
- 19.11.1. Business Overview
- 19.11.2. Product Offerings
- 19.12. BOYD
- 19.12.1. Business Overview
- 19.12.2. Product Offerings
- 19.13. CANOVATE
- 19.13.1. Business Overview
- 19.13.2. Product Offerings
- 19.14. CARRIER
- 19.14.1. Business Overview
- 19.14.2. Product Offerings
- 19.15. CASTROL
- 19.15.1. Business Overview
- 19.15.2. Product Offerings
- 19.16. CITEC INTERNATIONAL
- 19.16.1. Business Overview
- 19.16.2. Product Offerings
- 19.17. CLIMATEWORX INTERNATIONAL
- 19.17.1. Business Overview
- 19.17.2. Product Offerings
- 19.18. COOLCENTRIC
- 19.18.1. Business Overview
- 19.18.2. Product Offerings
- 19.19. COOLER MASTER
- 19.19.1. Business Overview
- 19.19.2. Product Offerings
- 19.20. COOLIT SYSTEMS
- 19.20.1. Business Overview
- 19.20.2. Product Offerings
- 19.21. CURTISS-WRIGHT
- 19.21.1. Business Overview
- 19.21.2. Product Offerings
- 19.22. DAIKIN APPLIED
- 19.22.1. Business Overview
- 19.22.2. Product Offerings
- 19.23. DANFOSS
- 19.23.1. Business Overview
- 19.23.2. Product Offerings
- 19.24. DCX LIQUID COOLING SYSTEMS
- 19.24.1. Business Overview
- 19.24.2. Product Offerings
- 19.25. DELL TECHNOLOGIES
- 19.25.1. Business Overview
- 19.25.2. Product Offerings
- 19.26. DELTA ELECTRONICS
- 19.26.1. Business Overview
- 19.26.2. Product Offerings
- 19.27. DOW
- 19.27.1. Business Overview
- 19.27.2. Product Offerings
- 19.28. DUG
- 19.28.1. Business Overview
- 19.28.2. Product Offerings
- 19.29. EBM-PAPST
- 19.29.1. Business Overview
- 19.29.2. Product Offerings
- 19.30. EMICON
- 19.30.1. Business Overview
- 19.30.2. Product Offerings
- 19.31. ENGIE REFRIGERATION
- 19.31.1. Business Overview
- 19.31.2. Product Offerings
- 19.32. ENVICOOL
- 19.32.1. Business Overview
- 19.32.2. Product Offerings
- 19.33. EVAPCO
- 19.33.1. Business Overview
- 19.33.2. Product Offerings
- 19.34. EXXONMOBIL
- 19.34.1. Business Overview
- 19.34.2. Product Offerings
- 19.35. FLAKTGROUP
- 19.35.1. Business Overview
- 19.35.2. Product Offerings
- 19.36. FLEX
- 19.36.1. Business Overview
- 19.36.2. Product Offerings
- 19.37. FLOWSERVE
- 19.37.1. Business Overview
- 19.37.2. Product Offerings
- 19.38. FOURIER COOLING
- 19.38.1. Business Overview
- 19.38.2. Product Offerings
- 19.39. FUJITSU
- 19.39.1. Business Overview
- 19.39.2. Product Offerings
- 19.40. GIGABYTE
- 19.40.1. Business Overview
- 19.40.2. Product Offerings
- 19.41. GREEN REVOLUTION COOLING
- 19.41.1. Business Overview
- 19.41.2. Product Offerings
- 19.42. GUNTNER
- 19.42.1. Business Overview
- 19.42.2. Product Offerings
- 19.43. HEWLETT PACKARD ENTERPRISE
- 19.43.1. Business Overview
- 19.43.2. Product Offerings
- 19.44. HIREF S.P.A
- 19.44.1. Business Overview
- 19.44.2. Product Offerings
- 19.45. HITACHI
- 19.45.1. Business Overview
- 19.45.2. Product Offerings
- 19.46. HUAWEI TECHNOLOGIES
- 19.46.1. Business Overview
- 19.46.2. Product Offerings
- 19.47. IBM
- 19.47.1. Business Overview
- 19.47.2. Product Offerings
- 19.48. ICEOTOPE
- 19.48.1. Business Overview
- 19.48.2. Product Offerings
- 19.49. INSPUR
- 19.49.1. Business Overview
- 19.49.2. Product Offerings
- 19.50. JOHNSON CONTROLS
- 19.50.1. Business Overview
- 19.50.2. Product Offerings
- 19.51. KAORI HEAT TREATMENT
- 19.51.1. Business Overview
- 19.51.2. Product Offerings
- 19.52. KELVION
- 19.52.1. Business Overview
- 19.52.2. Product Offerings
- 19.53. KOOLANCE
- 19.53.1. Business Overview
- 19.53.2. Product Offerings
- 19.54. KSTAR
- 19.54.1. Business Overview
- 19.54.2. Product Offerings
- 19.55. LEGRAND
- 19.55.1. Business Overview
- 19.55.2. Product Offerings
- 19.56. LENOVO
- 19.56.1. Business Overview
- 19.56.2. Product Offerings
- 19.57. LIQUIDCOOL SOLUTIONS
- 19.57.1. Business Overview
- 19.57.2. Product Offerings
- 19.58. LIQUIDSTACK
- 19.58.1. Business Overview
- 19.58.2. Product Offerings
- 19.59. MIDAS IMMERSION COOLING
- 19.59.1. Business Overview
- 19.59.2. Product Offerings
- 19.60. MIKROS TECHNOLOGIES
- 19.60.1. Business Overview
- 19.60.2. Product Offerings
- 19.61. MITSUBISHI ELECTRIC
- 19.61.1. Business Overview
- 19.61.2. Product Offerings
- 19.62. MOOG
- 19.62.1. Business Overview
- 19.62.2. Product Offerings
- 19.63. MOTIVAIR BY SCHNEIDER ELECTRIC
- 19.63.1. Business Overview
- 19.63.2. Product Offerings
- 19.64. MUNTERS
- 19.64.1. Business Overview
- 19.64.2. Product Offerings
- 19.65. NIDEC CORPORATION
- 19.65.1. Business Overview
- 19.65.2. Product Offerings
- 19.66. NORTEK DATA CENTER COOLING
- 19.66.1. Business Overview
- 19.66.2. Product Offerings
- 19.67. NVENT
- 19.67.1. Business Overview
- 19.67.2. Product Offerings
- 19.68. OPTICOOL TECHNOLOGIES
- 19.68.1. Business Overview
- 19.68.2. Product Offerings
- 19.69. RENOVO ZHUHAI
- 19.69.1. Business Overview
- 19.69.2. Product Offerings
- 19.70. SHANGHAI SHENGLIN M&E TECHNOLOGY
- 19.70.1. Business Overview
- 19.70.2. Product Offerings
- 19.71. SMC
- 19.71.1. Business Overview
- 19.71.2. Product Offerings
- 19.72. SPX TECHNOLOGIES
- 19.72.1. Business Overview
- 19.72.2. Product Offerings
- 19.73. STELLAR ENERGY
- 19.73.1. Business Overview
- 19.73.2. Product Offerings
- 19.74. STULZ
- 19.74.1. Business Overview
- 19.74.2. Product Offerings
- 19.75. SUBMER
- 19.75.1. Business Overview
- 19.75.2. Product Offerings
- 19.76. SUPERMICRO
- 19.76.1. Business Overview
- 19.76.2. Product Offerings
- 19.77. SWEGON
- 19.77.1. Business Overview
- 19.77.2. Product Offerings
- 19.78. THE LUBRIZOL CORPORATION
- 19.78.1. Business Overview
- 19.78.2. Product Offerings
- 19.79. TRANE
- 19.79.1. Business Overview
- 19.79.2. Product Offerings
- 19.80. VALVOLINE
- 19.80.1. Business Overview
- 19.80.2. Product Offerings
- 19.81. VERTIV
- 19.81.1. Business Overview
- 19.81.2. Product Offerings
- 19.82. Wakefield Thermal
- 19.82.1. Business Overview
- 19.82.2. Product Offerings
- 19.83. ZUTACORE
- 19.83.1. Business Overview
- 19.83.2. Product Offerings
20. QUANTITATIVE SUMMARY
21. APPENDIX
- 21.1. LIST OF ABBREVIATIONS
- 21.2. CURRENCY CONVERSION
Select a license type that suits your business needs
Single User Licence
- Report accessible by one user only
- Free 10% or 3 days of customization
- Free post-sale service assistance
- Continuous support through email
5 User Licence
- Report accessible by 5 users within the organization
- Free 15% or 4.5 days of customization
- Continuous support through email and telephone
- Free analyst hour
- Free Upgrade: If an updated report published within 180 days of purchase, you will get the revised report free of charge
Corporate Licence
- Free Datasheet worth $1500
- Report accessible by the entire organization
- Free 20% or 6 days of customization
- Free post-sale service assistance
- Continuous support through email and telephone
- Direct access to lead analysts
- Free analyst hour
- Free Upgrade: If an updated report published within 180 days of purchase, you will get the revised report free of charge
Datasheet Licence
- Report accessible by 1 user only
- Free 15% or 32 hours of customization
- Free post-sale service assistance
- Direct access to lead analysts
Frequently Asked Questions
What is the growth rate of the global data center liquid cooling market?
How big is the global data center liquid cooling market?
What are the key trends in the global data center liquid cooling market?