Latin America E-Learning Market Research Report 2025-2030
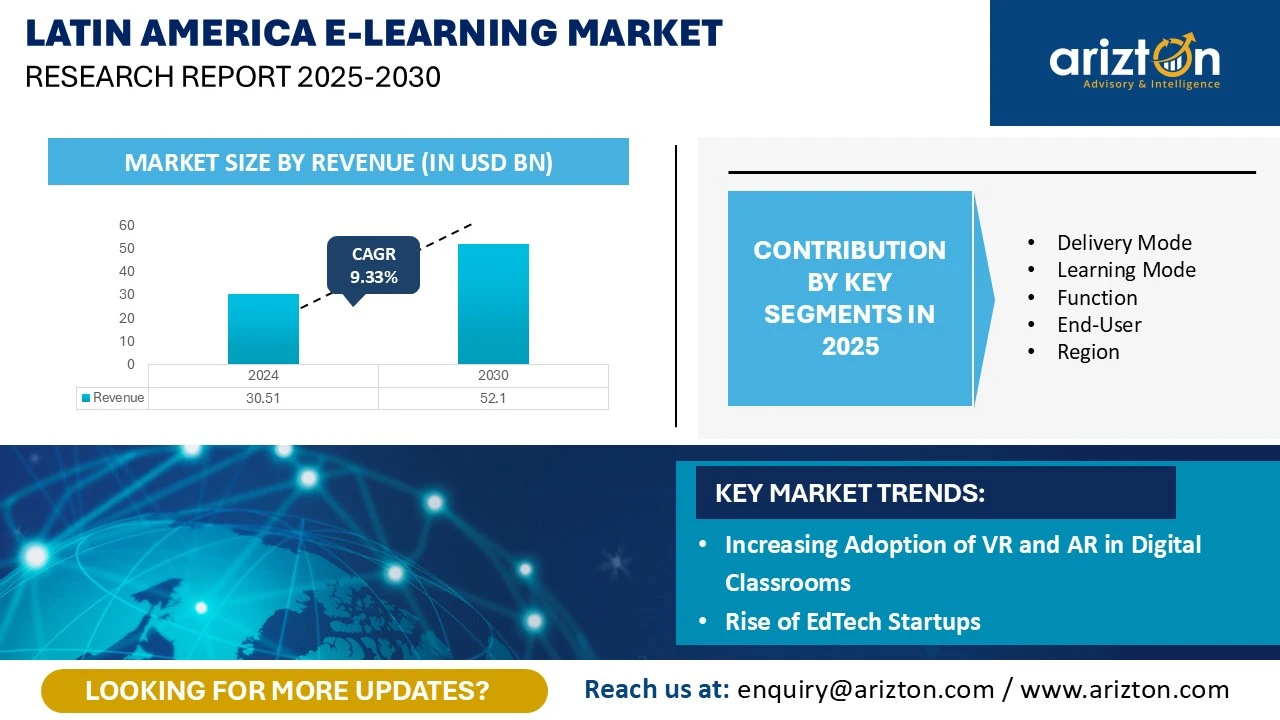
THE LATIN AMERICA E-LEARNING MARKET WAS VALUED AT USD 30.51 BILLION IN 2024 AND IS EXPECTED TO REACH USD 52.10 BILLION BY 2030, GROWING AT A CAGR OF 9.33% DURING THE FORECAST PERIOD.

The Latin America E-Learning Market Size, Share & Trends By Delivery Mode, By Learning Mode, By Function, By End-User, & By Region. The Industry Analysis Includes Market Size and Value (in USD Billions) for the Listed Segments, With Data Spanning 10 Years
Published Date : September 2025
Last Updated : September 2025
format: PDF
edition : Second Edition
100 pages
08 tables
20 charts
1 region
7 countries
25 company
05 segments
Purchase Options
Latin America E-Learning Market Research Report 2025-2030
THE LATIN AMERICA E-LEARNING MARKET WAS VALUED AT USD 30.51 BILLION IN 2024 AND IS EXPECTED TO REACH USD 52.10 BILLION BY 2030, GROWING AT A CAGR OF 9.33% DURING THE FORECAST PERIOD.
The Latin America E-Learning Market Size, Share & Trend Analysis Report By
- Delivery Mode: LMS, Packaged Content, and Others
- Learning Mode: Self-Paced and Instructor-Led
- Function: Training and Testing
- End-User: Corporate, Higher Education, K-12, Government, and Vocational
- Region: Brazil, Mexico, Argentina, Chile, Colombia, Peru, and Ecuador
Industry Analysis Report, Regional Outlook, Growth Potential, Price Trends, Competitive Market Share & Forecast 2025–2030.
This report includes market data points, ranging from trend
analyses to market estimates & forecasts that you can customize
LATIN AMERICA E-LEARNING MARKET REPORT SCOPE
| REPORT ATTRIBUTE | DETAILS |
|---|---|
| Market Size (2030) | USD 52.10 Billion |
| Market Size (2024) | USD 30.51 Billion |
| CAGR (2024-2030) | 9.33% |
| HISTORIC YEAR | 2021-2023 |
| BASE YEAR | 2024 |
| FORECAST YEAR | 2025-2030 |
| LARGEST REGION (2024) | Brazil |
| SEGMENTS BY | Delivery Mode, Learning Mode, Function, End-User, and Region |
| REGIONAL ANALYSIS | Brazil, Mexico, Argentina, Chile, Colombia, Peru, and Ecuador |
| KEY PLAYERS | Telefonica, Pearson, Anthology, Cogna Educação, and Hotmart |
LATIN AMERICA E-LEARNING MARKET SIZE & SHARE
The Latin America e-learning market was valued at USD 30.51 billion in 2024 and is expected to reach USD 52.10 billion by 2030, growing at a CAGR of 9.33% during the forecast period. The market incorporates digital platforms, software, and services that facilitate remote and technology-driven education across academic institutions, corporate training centers, and government initiatives. This market includes online learning management systems (LMS), virtual classrooms, mobile learning applications, and cloud-based educational content tailored for students, professionals, and lifelong learners. The adoption of e-learning has accelerated in recent years due to evolving educational models, increasing Internet penetration, and a growing emphasis on skill development in a rapidly changing job landscape.
The widespread adoption of digital learning platforms by educational institutions at all levels is one of the primary reasons that is fueling the growth of the Latin America e-learning market. Universities, technical colleges, and K–12 schools are increasingly integrating Learning Management Systems (LMS) and virtual classrooms to enhance teaching methodologies and improve student engagement.
The shift toward remote work and the increasing need for continuous professional development have significantly boosted the demand for e-learning platforms in the corporate sector across Latin America. Companies are investing in digital training programs to upskill employees, ensure compliance with industry standards, and maintain competitiveness in a rapidly evolving economy.
LATIN AMERICA E-LEARNING MARKET NEWS
On 15 July 2025, Pearson opened an innovation and research hub in London, dedicated to developing products and services powered by emerging technologies. The initiative aims to advance the future of learning in schools and workplaces worldwide, including Latin America, ensuring that Pearson continues to lead in technology-driven educational solutions.
On July 15, 2025, Anthology introduced next-generation AI and immersive learning innovations within its Blackboard® platform, reinforcing its position as the fastest-evolving LMS for the fourth consecutive year. The new capabilities focus on streamlining instructional design, reducing faculty administrative tasks, and enhancing student engagement, underlining Anthology’s commitment to responsible AI adoption and institutional success in higher education.
KEY TAKEAWAYS
- Market Growth: The Latin America e-learning market size was valued at USD 30.51 billion in 2024 and is expected to reach USD 52.10 billion by 2030, growing at a CAGR of 9.33% during the forecast period.
- By Delivery Mode: The packaged content segment accounted for the largest market share of over 57%.
- By Learning Mode: The self-paced segment shows the highest growth, with the fastest-growing CAGR of 12.46% during the forecast period.
- By Function: The training method holds the largest Latin American e-learning market share.
- By End-User: The corporate segment dominates and holds the largest market share.
- By Region: The Brazil region accounted for the largest market share of over 25%.
- Growth Factor: The Latin America e-learning market is set to grow due to a rise in government programs & initiatives and growing internet & smartphone penetration.
LATIN AMERICA E-LEARNING MARKET TRENDS
- Increasing Adoption of VR and AR in Digital Classrooms: Immersive AR/VR tools are enhancing student engagement and experiential learning, despite cost and infrastructure barriers.
- Growth in Gamification & Interactive Content: Gamified learning is boosting motivation and retention through interactive and reward-based content formats
- Increment in Adoption of Mobile Learning: Smartphone-driven education is rapidly expanding through low-data apps, AI tools, and supportive government policies.
- Rise of EdTech Startups: Local EdTech startups are transforming access to flexible, skill-based learning by partnering with public systems and using localized content.
LATIN AMERICA E-LEARNING MARKET DRIVERS
- Rise in Government Programs & Initiatives: National initiatives are increasing digital access, infrastructure, and content delivery to support equitable E-learning.
- Growing Internet & Smartphone Penetration: High smartphone and internet penetration are enabling scalable access to mobile-based education across the region.
- Rise in Demand for Flexible Learning: Learners are increasingly seeking self-paced, customizable education formats for better work-life balance and access.
- Increased Digitization Initiatives in Schools: Public and private investments are modernizing classrooms with digital tools and hybrid learning environments.
LATIN AMERICA E-LEARNING MARKET SEGMENTATION INSIGHTS
INSIGHT BY DELIVERY MODE
The Latin America e-learning market by delivery mode is segmented into LMS, packaged content, and others. The packaged content segment accounted for the largest market share of over 57%, driven by the need for high-quality, cost-effective, and scalable learning resources. Educational institutions across the region are increasingly integrating pre-developed, multimedia-rich modules into their curricula to address the rapid shift toward digital and hybrid learning models. These modules cover a broad spectrum of subjects, including STEM, business studies, foreign languages, and vocational training, and often feature videos, simulations, quizzes, and gamified assessments to improve engagement and retention.
One of the most notable growth factors is the localization of content in Spanish and Portuguese, ensuring cultural and linguistic relevance, which is particularly important in diverse markets such as Brazil, Mexico, Colombia, and Argentina. Government education modernization programs are also stimulating demand for curriculum-aligned packaged content, especially in rural areas where teacher shortages and resource limitations make digital resources critical. In the corporate sector, industries such as finance, healthcare, and manufacturing are increasingly deploying packaged compliance, safety, and skills-training modules to quickly onboard employees and maintain operational standards.
INSIGHT BY LEARNING MODE
The Latin America e-learning market by learning mode is categorized into self-paced and instructor-led. The self-paced segment shows the highest growth, with the fastest-growing CAGR of 12.46% during the forecast period. The self-paced segment’s growth is supported by the region’s growing preference for flexible, learner-controlled education formats. Self-paced courses allow students and professionals to progress at their own speed, making them particularly attractive to working adults, remote learners, and individuals seeking to acquire specific skills without committing to fixed schedules. This learning mode is widely used in professional certification programs, language learning, technical skill development, and corporate compliance training.
The growth of this segment is underpinned by increasing smartphone penetration, improved internet connectivity, and the widespread availability of affordable, subscription-based learning platforms. EdTech companies are offering self-paced modules with multimedia content, including videos, interactive assessments, and gamification features, to enhance engagement and retention. Additionally, the availability of offline access options addresses connectivity challenges in rural and semi-urban areas, expanding the segment’s reach.
INSIGHT BY FUNCTION
Based on the function, the training method holds the largest Latin America e-learning market share, driven by the growing need for skill development, professional upskilling, and curriculum modernization across the region. Educational institutions are increasingly using digital training modules to enhance subject comprehension, improve teaching methodologies, and offer supplementary learning materials for students at all levels. In the corporate sector, organizations across industries such as manufacturing, finance, healthcare, and retail are leveraging online training programs to improve workforce productivity, ensure compliance with regulatory standards, and facilitate continuous learning.
The expansion of this segment is supported by the availability of diverse training formats, including self-paced modules, instructor-led sessions, and blended learning models. Cloud-based platforms and mobile learning applications are enabling anytime, anywhere access to training materials, which is particularly valuable in geographically dispersed regions where traditional training infrastructure is limited. The use of interactive and multimedia content, such as videos, simulations, and gamified learning, has also enhanced learner engagement and retention rates.
INSIGHT BY END-USER
By end-user, the corporate segment dominates and holds the largest Latin America e-learning market share. Organizations across sectors such as manufacturing, finance, healthcare, retail, and IT are increasingly adopting e-learning platforms to deliver scalable, cost-effective training to geographically dispersed employees. The shift toward remote and hybrid work models has further accelerated digital learning adoption, with companies leveraging virtual classrooms, self-paced modules, and mobile learning apps to ensure accessibility across devices.
Key growth drivers include the need to address skill shortages, the implementation of new technologies in business operations, and stricter regulatory compliance requirements. Corporate e-learning programs often cover technical skills, soft skills, language training, and industry-specific certifications. The integration of analytics tools into corporate training platforms enables HR departments to track employee performance, identify skill gaps, and personalize training content. Gamification features and simulation-based learning are also being used to enhance engagement and practical skill development.
LATIN AMERICA E-LEARNING MARKET REGIONAL ANALYSIS
The Brazilian region accounted for the largest Latin American e-learning market share of over 25%, fueled by factors such as increasing internet penetration, demand for flexible learning solutions, and government initiatives to promote digital education. The market encompasses a wide range of sectors, including K-12 education, higher education, corporate training, and vocational courses. Brazil’s e-learning market is heavily influenced by the country’s technological infrastructure, including internet connectivity, mobile device usage, and access to digital platforms. Advances in technology have enabled the development of innovative e-learning solutions, such as mobile learning apps, virtual classrooms, and interactive multimedia content.
In Brazil, the integration of artificial intelligence (AI) and adaptive learning technologies presents a significant opportunity for the e-learning market by enabling personalized, data-driven education experiences. AI-powered platforms can analyze learner behavior, track progress, and deliver customized content, enhancing engagement and knowledge retention across academic and professional settings.
In 2023, the Ministry of Education launched a national pilot program to test AI-based learning solutions in select public universities and high schools to reduce dropout rates and improve academic performance. These initiatives are driving innovation in Brazil’s online education ecosystem.
LATIN AMERICA E-LEARNING MARKET VENDOR LANDSCAPE
The Latin America e-learning market report contains exclusive data on 25 vendors. Anthology, through Blackboard, is advancing as an AI-driven LMS focused on immersive learning and student lifecycle management. Pearson remains strong in global learning platforms like Pearson+ and PTE Academic, leading in content and assessments, while Anthology dominates institutional tech infrastructure.
Hotmart leads the Creator Economy with Hotmart AI for independent educators, while Cogna focuses on large-scale education via Kroton, Saber, and Vasta. Hotmart thrives in digital entrepreneurship, whereas Cogna adapts its traditional academic base to digital transformation. Telefónica stands out by providing cybersecurity and infrastructure support with Tu Empresa Segura Lite and cloud services, ensuring data integrity and privacy. Unlike content-focused rivals, its value lies in securing e-learning ecosystems.
In Latin America, Cogna dominates formal education, while Hotmart leads in monetized digital learning. Anthology and Pearson extend global platforms into the region, and Telefónica leverages its telecom base to support secure digital education. AI is the common battleground, Anthology powers Blackboard with AI, Pearson drives innovation through research, Cogna invests in generative AI, Hotmart enables creators with AI tools, and Telefónica uses AI for cyber protection. Success depends on how each applies AI to their core audiences.
SNAPSHOT
The Latin America e-learning market size is expected to grow at a CAGR of approximately 9.33% from 2024 to 2030.
Base Year: 2024
Forecast Year: 2025-2030
The report considers the present scenario of Latin America e-learning and its market dynamics for 2025−2030. It covers a detailed overview of several market growth enablers, restraints, and trends. The study covers both the demand and supply sides of the market. It also profiles and analyzes leading companies and several other prominent companies operating in the market.
Key Vendors
- Telefonica
- Business Overview
- Product Offerings
- Key Developments
- Key Strategies
- Key Opportunities
- Key Strengths
- Pearson
- Anthology
- Cogna Educação
- Hotmart
Other Prominent Vendors
- EADSKILL
- Business Overview
- Product Offerings
- Teachy
- Innovamat
- edX
- isEazy
- Alicerce Educação
- EBAC (European School of Arts)
- Veduca
- Learncafe
- Alura
- eduK
- Buzzero
- Cursos 24 Horas
- Skillsoft
- Estratégia Concursos
- Degrau Cultural
- Udemy
- Letrus
- Coursera
- LinkedIn Learning
SEGMENTATION & FORECASTS
- By Delivery Mode
- LMS
- Packaged Content
- Others
- By Learning Mode
- Self-Paced
- Instructor-Led
- By Function
- Training
- Testing
- By End-User
- Corporate
- Higher Education
- K-12
- Government
- Vocational
- By Region
- Latin America
- Brazil
- Mexico
- Argentina
- Chile
- Colombia
- Peru
- Ecuador
LATIN AMERICA E-LEARNING MARKET FAQs
Who are the major players in the Latin American e-learning market?
How big is the Latin America e-learning market?
Which region dominates the Latin America e-learning market?
What are the key drivers of the Latin America e-learning market?
What is the growth rate of the Latin American e-learning market?
EXHIBIT 1 Latin America E-Learning Market 2021-2030 ($ Billion)
EXHIBIT 2 Latin America E-Learning Market by Packaged Content 2021-2030 ($ Billion)
EXHIBIT 3 Latin America E-Learning Market by LMS 2021-2030 ($ Billion)
EXHIBIT 4 Latin America E-Learning Market by Others 2021-2030 ($ Billion)
EXHIBIT 5 Latin America E-Learning Market by Self-Paced 2021-2030 ($ Billion)
EXHIBIT 6 Latin America E-Learning Market by Instructor-Led 2021-2030 ($ Billion)
EXHIBIT 7 Latin America E-Learning Market by Training 2021-2030 ($ Billion)
EXHIBIT 8 Latin America E-Learning Market by Testing 2021-2030 ($ Billion)
EXHIBIT 9 Latin America E-Learning Market by Corporate 2021-2030 ($ Billion)
EXHIBIT 10 Latin America E-Learning Market by Higher Education 2021-2030 ($ Billion)
EXHIBIT 11 Latin America E-Learning Market by K-12 2021-2030 ($ Billion)
EXHIBIT 12 Latin America E-Learning Market by Government 2021-2030 ($ Billion)
EXHIBIT 13 Latin America E-Learning Market by Vocational 2021-2030 ($ Billion)
EXHIBIT 14 E-Learning Market in Brazil 2021-2030 ($ Billion)
EXHIBIT 15 E-Learning Market in Mexico 2021-2030 ($ Billion)
EXHIBIT 16 E-Learning Market in Argentina 2021-2030 ($ Billion)
EXHIBIT 17 E-Learning Market in Chile 2021-2030 ($ Billion)
EXHIBIT 18 E-Learning Market in Colombia 2021-2030 ($ Billion)
EXHIBIT 19 E-Learning Market in Peru 2021-2030 ($ Billion)
EXHIBIT 20 E-Learning Market in Ecuador 2021-2030 ($ Billion)
LIST OF TABLES
Table 1 Latin America E-learning Market by Delivery Mode (2021-2023) ($ Billion)
Table 2 Latin America E-learning Market by Delivery Mode (2024-2030) ($ Billion)
Table 3 Latin America E-learning Market by Learning Mode (2021-2023) ($ Billion)
Table 4 Latin America E-learning Market by Learning Mode (2024-2030) ($ Billion)
Table 5 Latin America E-learning Market by Function (2021-2023) ($ Billion)
Table 6 Latin America E-learning Market by Function (2024-2030) ($ Billion)
Table 7 Latin America E-learning Market by End-User (2021-2023) ($ Billion)
Table 8 Latin America E-learning Market by End-User (2024-2030) ($ Billion)
CHAPTER – 1: Latin America E-learning Market Overview
- Executive Summary
- Key Findings
- Key Developments
CHAPTER – 2: Latin America E-learning Market Segmentation Data
- Delivery Mode Market Insights (2021-2030)
- LMS
- Packaged Content
- Others
- Learning Mode Market Insights (2021-2030)
- Self-Paced
- Instructor-Led
- Function Market Insights (2021-2030)
- Training
- Testing
- End-User Market Insights (2021-2030)
- Corporate
- Higher Education
- K-12
- Government
- Vocational
CHAPTER – 3: Latin America E-learning Market Prospects & Opportunities
- Latin America E-learning Market Drivers
- Latin America E-learning Market Trends
- Latin America E-learning Market Constraints
CHAPTER – 4: Latin America E-learning Market Overview
- Latin America E-learning Market -Competitive Landscape
- Latin America E-learning Market - Key Players
- Latin America E-learning Market - Key Company Profiles
CHAPTER – 5: Appendix
- Research Methodology
- Abbreviations
- Arizton
Select a license type that suits your business needs
Single User Licence
- Report accessible by one user only
- Free 10% or 3 days of customization
- Free post-sale service assistance
- Continuous support through email
5 User Licence
- Report accessible by 5 users within the organization
- Free 15% or 4.5 days of customization
- Continuous support through email and telephone
- Free analyst hour
- Free Upgrade: If an updated report published within 180 days of purchase, you will get the revised report free of charge
Corporate Licence
- Free Datasheet worth $1500
- Report accessible by the entire organization
- Free 20% or 6 days of customization
- Free post-sale service assistance
- Continuous support through email and telephone
- Direct access to lead analysts
- Free analyst hour
- Free Upgrade: If an updated report published within 180 days of purchase, you will get the revised report free of charge
Datasheet Licence
- Report accessible by 1 user only
- Free 15% or 32 hours of customization
- Free post-sale service assistance
- Direct access to lead analysts
Frequently Asked Questions
Who are the major players in the Latin American e-learning market?
How big is the Latin America e-learning market?
Which region dominates the Latin America e-learning market?
What are the key drivers of the Latin America e-learning market?
What is the growth rate of the Latin American e-learning market?
Other RELATED Reports