Vegetable Wax Market - Global Outlook and Forecast 2020-2025
VEGETABLE WAX MARKET SIZE TO REACH USD 130 MILLION IN 2020, GROWING AT A CAGR OF AROUND 6% DURING THE FORECAST PERIOD
VEGETABLE WAX MARKET SIZE TO REACH USD 130 MILLION IN 2020, GROWING AT A CAGR OF AROUND 6% DURING THE FORECAST PERIOD
This report includes market data points, ranging from trend
analyses to market estimates & forecasts that you can customize
VEGETABLE WAX MARKET REPORT SCOPE
| REPORT ATTRIBUTE | DETAILS |
|---|---|
| Market Size (Revenue) | USD 130 Million (2020) |
| CAGR | 6% (2020-2025) |
| Base Year | 2019 |
| Forecast Year | 2020-2025 |
| Market Segments | Wax Type (Carnauba, Candelilla, Castor, And Others), Application (Candles, Cosmetic, Food, Industry, And Others), Distribution (Wholesale And Retail) |
| Geographic Analysis | APAC, Europe, Middle East & Africa, North America, and Latin America |
| Countries Covered | UK, France, Spain, Italy, Germany, Nordic, China, Japan, India, Australia, South Korea, US, Canada, Brazil, Mexico, Argentina, UAE, Saudi Arabia, and South Africa |
INDUSTRY INSIGHTS
The vegetable wax market size to reach USD 130 million in 2020, growing at a CAGR of around 6% during the forecast period. The shift from synthetic to natural products across the globe, especially after 2010, has increased the utility of vegetable wax significantly. There has been a growing trend across the world in the last few years toward natural products. Customers opt for additive-free; hence manufacturers focus on natural ingredients, and marketers seek to replace synthetic chemicals in personal care products with safe, organic substitutes without compromising the sensory experience. Hence, changes in consumer behaviors and the shift toward organic products have augured well for the vegetable wax market.
Several global studies have emphasized the certain negative impact of synthetic materials on human health, thereby increasing the need for cleaner and safe raw materials. This, in turn, has largely affected the consumer product-based markets such as cosmetics and food. This conscious way of living goes hand in hand with making informed decisions about buying products with organic and natural labels. Millennials and Gen Z are checking the ingredients before they buy products. This has widely pushed industry manufacturers to opt for natural raw materials, which, in turn, have increased vast opportunities for the suppliers. Hence, the demand for cleaner raw materials is likely to push the demand for vegetable wax market further during the forecast period.
SNIPPETS
- APAC is expected to witness steady traction for vegetable wax products during the forecast period.
- Brazil, Russia, India, and China are likely to witness an increase in market shares with customers shifting toward natural and organic products.
- The castor wax segment is expected to grow at a CAGR of over 6% during the period 2019–2025 due to its increasing usage in several cosmetic products such as lipsticks, lotions, and creams.
VEGETABLE WAX MARKET SEGMENTATION
The global vegetable wax research report includes a detailed segmentation by
- Distribution
- Product
- Application
- Geography
INSIGHTS BY PRODUCTS
The growing health awareness, along with the specific shift toward the adoption of organic wax products, has pushed the candelilla wax industry. Companies catering in this segment have extremely focused on R&D to produce several organic products. This, in turn, push them to formulate several combinations of paraffin and other waxes. It is the most dominantly used in the food glazing market. It is expected that the increase in demand for processed meat, fish & poultry, and functional foods would drive the demand. In the near future, the growing application of food glazing agents in bakery and confectionery products due to the increasing preference for personalized food items is expected to affect the demand.
The carnauba wax industry growth is driven by highly favorable legislation concerning the use of them as a glazing agent in edible items such as candies, chocolates, and cosmetics. Their usage as a coating medium for regulated pharmaceutical release systems has increased the demand in the pharmaceutical industry. Furthermore, the carnauba segment has witnessed advances in technology, primarily related to wax extraction, and the production and processing techniques have made notable progress. The demand for carnauba wax has remained highly stable despite the availability of several alternatives, such as beeswax and candelilla wax. Superior properties such as permeability and shine have contributed to their widespread use in application industries.
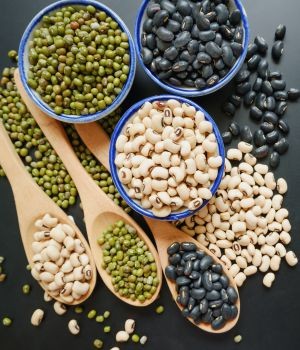
The demand for castor wax market has witnessed significant increments over the years. The growing demand can be attributed due to stringency in government regulations for the use of synthetic chemicals. Moreover, the price for castor seed has also declined in the past years owing to the increasing production in China, Jamaica, and other tropical regions.
INSIGHTS BY APPLICATION
Europe is an interesting candle market, where consumption and imports are constantly increasing. Candles, rather than purely functional items, have become decorative accessories. This offers wide opportunities, particularly in the upper-mid market segment for exporters from developing countries. Decorative and gift items retailers are enticing sources for this product. Poland is the principal supplier of candles in Europe. Further, consumer behavior is also moving toward the adoption of healthy natural candles such as soy ones. Soy candles are rapidly in demand as they are made of soybean oil, minimize carbon dioxide emissions, and burn 50% longer than paraffin candles.
Cosmetics has been one of the key application sectors where the use of vegetable wax has been witnessing high demand. This demand is mostly attributed due to the shift in the consumer preference for adopting natural products rather than going for synthetic products. The growth of natural and organic personal care products has also driven the market. Factors such as the expansion of distribution channels, increased customer reach online, and the shift of modern retailers to offering premium personal care products on the shelves are other factors fueling the growth of vegetable wax in the cosmetic industry. Moreover, new product development, advertising, and increased consumer spending capacity on premium products are primary factors driving the overall growth of the global natural and organic personal care market.
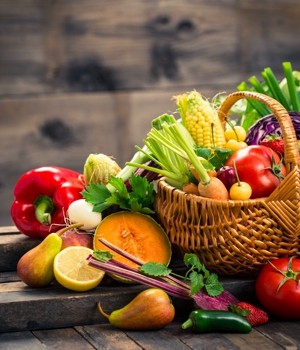
The food industry has widely used waxes to provide a protective coating to fruits and vegetables. Seeking the potential in the shifting consumer behavior, the food industry uses a variety of post-harvest techniques and natural wax to maintain quality and guarantee the longest possible shelf-life and satisfy consumer demand for fresh and healthy foods. The application of a protective coating on fruits and vegetables is an important factor driving growth.
INSIGHTS BY DISTRIBUTION
Distributors, retailers, and manufacturers are the major vegetable wax suppliers. Manufacturers such as Cargill have promoted the sale through the wholesale network via design models. Vendors, for example, in Europe, primarily sell finished products either through dealers or distributors or the internet. The growth in online sales is set to increase by over 5% during the forecast period. The primary reason for this is online stores offer a variety of options to choose from than retail stores. Besides, prices offered on the internet are lower than retail stores because of the discount offered by vendors to promote their products.
INSIGHTS BY GEOGRAPHY
The vegetable wax market in North America has vast potential with regard to consumption. Several application areas such as cosmetics, candles, and food among others have largely adopted the utilization of vegetable wax due to the growing awareness in consumers against the use of synthetic products. Therefore, customers turn to natural and organic products due to concerns about synthetic chemicals in cosmetics & toiletries.
In APAC, wax has wide applications, ranging from paints to textile, ink & coatings for packaging, cosmetics and pharmaceuticals to food, and electrical & electronics to rubber. Hence, their increased application in these end-user industries is generating a large-scale demand for natural wax. China remains one of the dominant players offering a variety of vegetable wax. The market is fragmented with numerous local and global payers. The cosmetic industry has accounted for decent growth in the last years.
Europe has one of the world's largest cosmetics industries. There is an increasing demand for natural ingredients in cosmetics and toiletries, a development anticipated to continue in the future. The consumer demand for cosmetics and toiletries that avoid contentious chemicals is expected to help fuel the growth. Strong demand for natural ingredients provides opportunities for potential suppliers in developing countries.
Mexico has strong market demand, especially candelilla ones. The country is one of the leading producers in the world. However, the outlook for industrial production remains uncertain as the labor supply needed for wax processing continues to decline.
The Middle East and African market has moderate demand for vegetable wax. This demand is driven by the utilization in several application segments, such as cosmetics and candles. Brands that produce organic beauty products driven from African plants and fruits have soothing, cleansing, and moisturizing properties. Further, countries such as Nigeria, South Africa, Ethiopia, Kenya, Uganda, Tanzania, and Mozambique have the largest consumer market, which has resulted in the industry’s growth over the past decade.
INSIGHTS BY VENDORS
The vegetable wax market is highly fragmented with many local and international players in the market. The competition is intense. The rapidly changing technological environment could adversely affect vendors as customers expect continual innovations and upgrades in the manufacturing of natural cosmetics products, pharma, among other application segments. The present scenario is forcing vendors to alter and refine their unique value proposition to achieve a strong presence.
Cargill and Koster Keunen are the key leading vendors in the market. The market concentration in developed countries such as the US and other Western European countries is high, while the market is in its growing stage in developing economies such as China and India because of the entry of global brands in these countries. The competition between vendors exists based on offerings and pricing. Vendors are using new business models and focusing on developing the portfolio of their establishments to drive growth. The focus in cosmetics is heavily shifting toward natural products, which is likely to provide vast opportunities to the vendors.
The vegetable wax market research report includes in-depth coverage of the industry with estimates & forecast in terms of revenue from 2019 to 2025 for the following segments:
Segmentation by Product
- Carnauba Wax
- Candelilla Wax
- Castor Wax
- Others
By Distribution
- Wholesale
- Online
By Application
- Candles
- Cosmetic
- Food
- Industry Applications
- Others
By Geography
-
Europe
- UK
- France
- Spain
- Italy
- Germany
- Nordic
-
APAC
- China
- Japan
- India
- Australia
- South Korea
-
North America
- US
- Canada
-
Latin America
- Brazil
- Mexico
- Argentina
-
Middle East & Africa
- UAE
- Saudi Arabia
- South Africa
SNAPSHOT
The global vegetable wax market is expected to grow at a CAGR of over 5% during the period 2019–2025.
The following factors are likely to contribute to the growth of the vegetable wax market during the forecast period:
- Growing Demand for Cleaner Raw Materials
- High Opportunities in Cosmetic Industry
- Increasing Environmental Concerns
- Expected rise in Demand from Candle & Food Sectors
Base Year: 2019
Forecast Year: 2020–2025
The study considers the present scenario of the vegetable wax market and its market dynamics for the period 2019−2025. It covers a detailed overview of several market growth enablers, restraints, and trends. The study offers both the demand and supply aspects of the market. It profiles and examines leading companies and other prominent companies operating in the market.
Key Vendors
- Cargill
- Business Overview
- Major Product Offerings
- Key Strengths
- Key Strategies
- Key Opportunities
- Huzhou Shentgtao Biotech
- Koster Keunen
Other Vendors
- Croda Industrial Chemicals
- Business Overview
- Key Strengths
- Key Strategies
- Brenntag (EPChem)
- Marcus Oil
- Argan Co.
- FAITH Industries
- BASF
- CALWAX
- PJ Group India
- Falcon
- Foncepi
- Carnaúba do Brasil
- Brasil Ceras
- KAVYA IMPEX
- Shri Ram Sons Wax Private Ltd.
Market Segmentation by Product
- Carnauba Wax
- Candelilla Wax
- Castor Wax
- Others
Market Segmentation by Distribution
- Wholesale
- Online
Market Segmentation by Application
- Candles
- Cosmetic
- Food
- Industry Applications
- Others
Market Segmentation by Geography
- Europe
- UK
- France
- Spain
- Italy
- Germany
- Nordic
- APAC
- China
- Japan
- India
- Australia
- South Korea
- North America
- US
- Canada
- Latin America
- Brazil
- Mexico
- Argentina
- MEA
- UAE
- Saudi Arabia
- South Africa
Frequently Asked Questions
What is the global vegetable wax market size and growth forecast?
What are the major factors that are driving the global vegetable wax market share?
Who are the leading vendors in the vegetable wax market?
Which segment will contribute maximum revenue to the vegetable wax market?
What are the latest industry trends and drivers in the market?
List of Exhibits
Exhibit 1 Segmentation of Global Vegetable Wax Market
Exhibit 2 Market Size Calculation Approach 2019
Exhibit 1 Penetration of Vegetable Wax in Global Wax Market 2019
Exhibit 2 Advantage of Vegetable Wax
Exhibit 3 Overview of Global Vegetable Wax Market 2019
Exhibit 4 Global Vegetable Wax Market by Geography 2025 (Revenue)
Exhibit 5 Global Vegetable Wax Market by Geography 2019 & 2025 (Revenue Share)
Exhibit 6 Impact of Rising Demand for Cleaner Raw Materials
Exhibit 7 Initiative taken for Developing Cleaner Material
Exhibit 8 Impact of Opportunity in Cosmetic Industry
Exhibit 9 Global Market Value for Natural Cosmetics 2018-2027 ($ billion)
Exhibit 10 Impact of Expected Rise in Demand from Candle & Food Sectors
Exhibit 11 Consumer Preferences in US (2019)
Exhibit 12 Impact of Increase in Environmental Concerns
Exhibit 13 Regulations Impacting Petroleum Wax Production in US
Exhibit 14 Impact of Emphasis on Human Health
Exhibit 15 Consumer Behavior Trends Impacting Manufacturing Process in Cosmetics Industry
Exhibit 16 Impact of Shifting Consumer Focus on Organic Products
Exhibit 17 Shifting Consumer Focus on Organic Products
Exhibit 18 Impact of Fluctuation in Material Price
Exhibit 19 Global Palm Oil Prices ($ per metric ton)
Exhibit 20 Impact of Political Problems Hampering Market Growth
Exhibit 21 Top Palm Oil Production Countries in 2019
Exhibit 22 Impact of Change in Climatic Conditions
Exhibit 23 Key Environmental Issues Impacting Vegetable Wax Production
Exhibit 24 General Value Chain Analysis of Vegetable Wax Market
Exhibit 25 Global Vegetable Wax Market: Historical Data 2017−2018
Exhibit 26 Global Vegetable Wax Market 2019–2025 ($ million)
Exhibit 27 Global Vegetable Wax Market 2019–2025 (million pounds)
Exhibit 28 Benefits of Vegetable Wax
Exhibit 29 Impact Value of Factors Affecting Global Vegetable Wax Market 2019 vs. 2025
Exhibit 30 ASP of Vegetable Wax Across Geographies 2019—2025 ($ per lbs.)
Exhibit 31 Global Natural Cosmetics Market 2018−2027 ($ billion)
Exhibit 32 CAGR Comparison Across Geography 2019—2025 (%)
Exhibit 33 Five Force Analysis 2019
Exhibit 34 Incremental Growth by Product 2019 & 2025 (Revenue)
Exhibit 35 Incremental Growth by Product 2019 & 2025 (Volume in Pounds)
Exhibit 36 Global Vegetable Wax Market by Product: Overview
Exhibit 37 Global Market Share by Product 2019
Exhibit 38 CAGR Comparison of Global Market by Product 2019−2025
Exhibit 39 Global Candelilla Wax Market 2019–2025 ($ million)
Exhibit 40 Global Candelilla Market 2019–2025 (million pounds)
Exhibit 41 Candelilla Market in the US in 2019 & 2020 ($ million)
Exhibit 42 Global Carnauba Wax Market 2019–2025 ($ million)
Exhibit 43 Carnauba Market in the US in 2019 & 2020 ($ million)
Exhibit 44 Global Carnauba Market 2019–2025 (million pounds)
Exhibit 45 Global Castor Wax Market 2019–2025 ($ million)
Exhibit 46 Castor Market in the US in 2019 & 2020 ($ million)
Exhibit 47 Global Castor Market 2019–2025 (million pounds)
Exhibit 48 Global Other Wax Market 2019–2025 ($ million)
Exhibit 49 Comparison of Share Accounted by Other Segment in 2019 & 2025 (Revenue)
Exhibit 50 Global Other Market 2019–2025 (million pounds)
Exhibit 51 Other Market by Geography 2019−2025 (million pounds)
Exhibit 52 Incremental Growth by Application 2019 & 2025 (Revenue)
Exhibit 53 Incremental Growth by Application 2019 & 2025 (Volume in Pounds)
Exhibit 54 Global Vegetable Wax Market by Application Type: Overview
Exhibit 55 Global Market Share by Application 2019
Exhibit 56 CAGR Comparison of Global Vegetable Wax by Application 2019−2025
Exhibit 57 Global Market in Candles 2019–2025 ($ million)
Exhibit 58 Global Market in Candles 2019–2025 (million pounds)
Exhibit 59 Global Market in Cosmetics 2019–2025 ($ million)
Exhibit 60 Global Market in Cosmetics 2019–2025 (million pounds)
Exhibit 61 Global Market in Food Sector 2019–2025 ($ million)
Exhibit 62 Global Market in Food Sector 2019–2025 (million pounds)
Exhibit 63 Global Market in Industrial Applications 2019–2025 ($ million)
Exhibit 64 Global Market in Industrial Application 2019–2025 (million pounds)
Exhibit 65 Global Market for Other Applications 2019–2025 ($ million)
Exhibit 66 Global Market for Other Applications 2019–2025 (million pounds)
Exhibit 67 Global Vegetable Wax Market by Distribution Channel
Exhibit 68 Incremental Growth by Geography 2019 & 2025 ($ million)
Exhibit 69 Incremental Growth by Geography 2019 & 2025 (Volume in pounds)
Exhibit 70 Global Vegetable Wax Market: Segmentation by Geography 2019 (% share)
Exhibit 71 Global Market: Segmentation by Geography 2025 (% share)
Exhibit 72 North America: Vegetable Wax Market Historical Data 2017−2018
Exhibit 73 PEST Analysis: North America
Exhibit 74 Market in North America 2019–2025 ($ million)
Exhibit 75 US GDP Growth Rate Changes Q1 2016–Q4 2018
Exhibit 76 Vegetable Wax Market in North America 2019–2025 (million pounds)
Exhibit 77 Incremental Growth in North America 2019 & 2025 (Revenue)
Exhibit 78 Incremental Growth in North America 2019 & 2025 (Volume in pounds)
Exhibit 79 Market in US 2019–2025 ($ million)
Exhibit 80 Market in US 2019–2025 (million pounds)
Exhibit 81 Market in Canada 2019–2025 ($ million)
Exhibit 82 Market in Canada 2019–2025 (million pounds)
Exhibit 83 APAC: Vegetable Wax Market Historical Data 2017−2018
Exhibit 84 Overview of PEST Analysis: APAC
Exhibit 85 Vegetable Wax Market in APAC 2019–2025 ($ million)
Exhibit 86 Market in APAC 2019–2025 (million pounds)
Exhibit 87 Forecast of Real GDP Growth by Group for Asia (% share)
Exhibit 88 Incremental Growth in APAC 2019 & 2025 (Revenue)
Exhibit 89 Incremental Growth in APAC 2019 & 2025 (Volume in pounds)
Exhibit 90 Market in China 2019–2025 ($ million)
Exhibit 91 Market in China 2019–2025 (million pounds)
Exhibit 92 Market in India 2019–2025 ($ million)
Exhibit 93 International Lifestyles Survey in 2019
Exhibit 94 Market in India 2019–2025 (million pounds)
Exhibit 95 Market in Japan 2019–2025 ($ million)
Exhibit 96 Shipment Value of Natural and Organic Cosmetics in Japan 2012-2018 ($ billion)
Exhibit 97 Market in Japan 2019–2025 (million pounds)
Exhibit 98 Market in Australia 2019–2025 ($ million)
Exhibit 99 Skin Care Market in Australia 2019 & 2020 ($ million)
Exhibit 100 Market in Australia 2019–2025 (million pounds)
Exhibit 101 Market in South Korea 2019–2025 ($ million)
Exhibit 102 Skin Care Market Revenue in South Korea for 2019 & 2020 ($ million)
Exhibit 103 Market in South Korea 2019–2025 (million pounds)
Exhibit 104 Europe: Vegetable Wax Market Historical Data 2017−2018
Exhibit 105 Overview of PEST Analysis: Europe
Exhibit 106 Vegetable Wax Market in Europe 2019–2025 ($ million)
Exhibit 107 Growth in European Natural Cosmetics Market 2013–2018 ($ billion)
Exhibit 108 Real GDP Growth Change EU vs. Global 2019-2024(% share)
Exhibit 109 Market in Europe 2019–2025 (million pounds)
Exhibit 110 Incremental Growth in Europe 2019 & 2025 (Revenue)
Exhibit 111 Incremental Growth in Europe 2019 & 2025 (Volume in pounds)
Exhibit 112 Market in UK 2019–2025 ($ million)
Exhibit 113 Market in UK 2019–2025 (million pounds)
Exhibit 114 Market in Germany 2019–2025 ($ million)
Exhibit 115 Market in Germany 2019–2025 (million pounds)
Exhibit 116 Market in France 2019–2025 ($ million)
Exhibit 117 Market in France 2019–2025 (million pounds)
Exhibit 118 Market in Italy 2019–2025 ($ million)
Exhibit 119 Italy in European Vegetable Wax Market 2019−2025 (% share)
Exhibit 120 Market in Italy 2019–2025 (million pounds)
Exhibit 121 Market in Spain 2019–2025 ($ million)
Exhibit 122 Natural Cosmetic Products in Spain 2019 & 2020 ($ million)
Exhibit 123 Market in Spain 2019–2025 (million pounds)
Exhibit 124 Market in Nordic Countries 2019–2025 ($ million)
Exhibit 125 Market in Nordic Countries 2019–2025 (million pounds)
Exhibit 126 Latin America: Vegetable Wax Market Historical Data 2017−2018
Exhibit 127 Overview of PEST Analysis: Latin America
Exhibit 128 Vegetable Wax Market in Latin America 2019–2025 ($ million)
Exhibit 129 Market in Latin America 2019–2025 (million pounds)
Exhibit 130 Incremental Growth in Latin America 2019 & 2025 (Revenue)
Exhibit 131 Incremental Growth in Latin America 2019 & 2025 (Volume in pounds)
Exhibit 132 Market in Mexico 2019–2025 ($ million)
Exhibit 133 Market in Mexico 2019–2025 (million pounds)
Exhibit 134 Market in Brazil 2019–2025 ($ million)
Exhibit 135 Market in Brazil 2019–2025 (million pounds)
Exhibit 136 Market in Argentina 2019–2025 ($ million)
Exhibit 137 Market in Argentina 2019–2025 (million pounds)
Exhibit 138 MEA: Vegetable Wax Market Historical Data 2017−2018
Exhibit 139 Overview of PEST Analysis: MEA
Exhibit 140 Vegetable Wax Market in Middle East & Africa 2019–2025 ($ million)
Exhibit 141 Market in MEA 2019–2025 (million pounds)
Exhibit 142 Incremental Growth in MEA 2019 & 2025 (Revenue)
Exhibit 143 Incremental Growth in MEA 2019 & 2025 (Volume in pounds)
Exhibit 144 Market in Saudi Arabia 2019–2025 ($ million)
Exhibit 145 Market in Saudi Arabia 2019–2025 (million pounds)
Exhibit 146 Market in UAE 2019–2025 ($ million)
Exhibit 147 Market in UAE 2019–2025 (million pounds)
Exhibit 148 Market in South Africa 2019–2025 ($ million)
Exhibit 149 Market in South Africa 2019–2025 (million pounds)
List of Tables
Table 1 Key Caveats
Table 2 Currency Conversion 2013−2019
Table 3 List of Top Palm Oil Producer Countries 2019
Table 4 Global Vegetable Wax Market by Geography 2019−2025 ($ million)
Table 5 Global Vegetable Wax Market by Geography 2019−2025 (million pounds)
Table 6 Candelilla Wax Market by Geography 2019−2025 ($ million)
Table 7 Market by Geography 2019−2025 (million pounds)
Table 8 Carnauba Wax Market by Geography 2019−2025 ($ million)
Table 9 Market by Geography 2019−2025 (million pounds)
Table 10 Global Castor Wax Market by Geography 2019−2025 ($ million)
Table 11 Global Castor Wax Market by Geography 2019−2025 (million pounds)
Table 12 Other Wax Market by Geography 2019−2025 ($ million)
Table 13 Global Vegetable Wax Market in Candles by Geography 2019−2025 ($ million)
Table 14 Global Market in Candles by Geography 2019−2025 (million pounds)
Table 15 Global Market in Cosmetics by Geography 2019−2025 ($ million)
Table 16 Global Market in Cosmetics by Geography 2019−2025 (million pounds)
Table 17 Global Market in Food Sector by Geography 2019−2025 ($ million)
Table 18 Global Market in Food Sector by Geography 2019−2025 (million pounds)
Table 19 Candelilla Wax Industrial Applications
Table 20 Global Market in Industrial Application by Geography 2019−2025 ($ million)
Table 21 Market in Industrial Applications by Geography 2019−2025 (million pounds)
Table 22 Global Market for Other Applications by Geography 2019−2025 ($ million)
Table 23 Global Market for Other Applications by Geography 2019−2025 (million pounds)
Table 24 Product Segment in North America 2019−2025 ($ million)
Table 25 Product Segment in North America 2019−2025 (million pound)
Table 26 Application Segment in North America 2019−2025 ($ million)
Table 27 Application Segment in North America 2019−2025 (million pounds)
Table 28 Change in Real GDP Growth in Key APAC Countries 2019 & 2020 (% share)
Table 29 Product Segment in APAC 2019−2025 ($ million)
Table 30 Product Segment in APAC 2019−2025 (million pound)
Table 31 Application Segment in APAC 2019−2025 ($ million)
Table 32 Application Segment in APAC 2019−2025 (million pounds)
Table 33 Product Segment in Europe 2019−2025 ($ million)
Table 34 Product Segment in Europe 2019−2025 (million pounds)
Table 35 Application Segment in Europe 2019−2025 ($ million)
Table 36 Application Segment in Europe 2019−2025 (million pounds)
Table 37 Macroeconomic Indicators (Forecast for 2019)
Table 38 Change in Real GDP Growth in Key Latin American Countries 2019 and 2020 (% share)
Table 39 Product Segment in Latin America 2019−2025 ($ million)
Table 40 Product Segment in Latin America 2019−2025 (million pounds)
Table 41 Application Segment in Latin America 2019−2025 ($ million)
Table 42 Application Segment in Latin America 2019−2025 (million pounds)
Table 43 Change in Real GDP Growth in Key MEA Countries 2019 & 2020 (% share)
Table 44 Product Segment in MEA 2019−2025 ($ million)
Table 45 Product Segment in MEA 2019−2025 (million pounds)
Table 46 Application Segment in MEA 2019−2025 ($ million)
Table 47 Application Segment in MEA 2019−2025 (million pounds)
Table 48 Cargill: Product Offerings End-use
Table 49 Huzhou Shengtao Biotech: Product Offerings
Table 50 Koster Keunen: Product Offerings
Table 51 Global Vegetable Wax Market by Geography 2019−2025 ($ million)
Table 52 Global Vegetable Wax Market by Geography 2019−2025 (million pounds)
Table 53 Product Segment in North America 2019−2025 ($ million)
Table 54 Product Segment in North America 2019−2025 (million pound)
Table 55 Application Segment in North America 2019−2025 ($ million)
Table 56 Application Segment in North America 2019−2025 (million pounds)
Table 57 Product Segment in APAC 2019−2025 ($ million)
Table 58 Product Segment in APAC 2019−2025 (million pound)
Table 59 Application Segment in APAC 2019−2025 ($ million)
Table 60 Application Segment in APAC 2019−2025 (million pounds)
Table 61 Product Segment in Europe 2019−2025 ($ million)
Table 62 Product Segment in Europe 2019−2025 (million pound)
Table 63 Application Segment in Europe 2019−2025 ($ million)
Table 64 Application Segment in Europe 2019−2025 (million pounds)
Table 65 Product Segment in Latin America 2019−2025 ($ million)
Table 66 Product Segment in Latin America 2019−2025 (million pound)
Table 67 Application Segment in Latin America 2019−2025 ($ million)
Table 68 Application Segment in Latin America 2019−2025 (million pounds)
Table 69 Product Segment in MEA 2019−2025 ($ million)
Table 70 Product Segment in MEA 2019−2025 (million pound)
Table 71 Application Segment in MEA 2019−2025 ($ million)
Table 72 Application Segment in MEA 2019−2025 (million pounds)
Table 73 Global Vegetable Wax Market by Product Segmentation 2019−2025 ($ million)
Table 74 Global Vegetable Wax Market by Product Segmentation 2019−2025 (million pounds)
Table 75 Candelilla Wax Market by Geography 2019−2025 ($ million)
Table 76 Market by Geography 2019−2025 (million pounds)
Table 77 Carnauba Wax Market by Geography 2019−2025 ($ million)
Table 78 Market by Geography 2019−2025 (million pounds)
Table 79 Castor Wax Market by Geography 2019−2025 ($ million)
Table 80 Market by Geography 2019−2025 (million pounds)
Table 81 Other Wax Market by Geography 2019−2025 ($ million)
Table 82 Market by Geography 2019−2025 (million pounds)
Table 83 Global Vegetable Wax Market by Application Segmentation 2019−2025 ($ million)
Table 84 Global Market by Application Segmentation 2019−2025 (million pounds)
Table 85 Global Vegetable Wax Market in Candles by Geography 2019−2025 ($ million)
Table 86 Global Market in Candles by Geography 2019−2025 (million pounds)
Table 87 Global Market in Cosmetics by Geography 2019−2025 ($ million)
Table 88 Global Market in Cosmetics by Geography 2019−2025 (million pounds)
Table 89 Global Market in Food Sector by Geography 2019−2025 ($ million)
Table 90 Global Market in Food Sector by Geography 2019−2025 (million pounds)
Table 91 Global Market in Industrial Applications by Geography 2019−2025 ($ million)
Table 92 Global Market in Industrial Applications by Geography 2019−2025 (million pounds)
Table 93 Global Market in Other Applications by Geography 2019−2025 ($ million)
Table 94 Global Market in Other Applications by Geography 2019−2025 (million pounds)
1 Research Methodology
2 Research Objectives
3 Research Process
4 Scope & Coverage
4.1 Market Definition
4.1.1 Inclusions
4.1.2 Exclusions
4.2 Base Year
4.3 Scope of The Study
4.3.1 Market Segmentation by Product
4.3.2 Market Segmentation by Application
4.3.3 Market Segmentation by Geography
5 Report Assumptions & Caveats
5.1 Key Caveats
5.2 Currency Conversion
5.3 Market Derivation
6 Market at a Glance
7 Introduction
7.1 Overview
8 Market Opportunities & Trends
8.1 Rising Demand for Cleaner Raw Materials
8.2 Opportunity in Cosmetic Industry
8.3 Expected Rise in Demand from Candle & Food Sectors
9 Market Growth Enablers
9.1 Increase in Environmental Concerns
9.2 Emphasis on Human Health
9.3 Shifting Consumer Focus on Organic Products
10 Market Restraints
10.1 Fluctuation in Material Price
10.2 Political Problems Hampering Market Growth
10.3 Change in Climatic Conditions
11 Value Chain Analysis
11.1 Value Chain Overview
11.1.1 Overview
11.1.2 Raw Material Suppliers
11.1.3 Manufacturers
11.1.4 Distributors/Dealers
11.1.5 Retailers
11.1.6 End-users
12 Market Landscape
12.1 Historical Data 2017—2018
12.2 Market Size & Forecast
12.2.1 Revenue
12.2.2 Volume
12.3 Market by Geography
12.3.1 Revenue
12.3.2 Volume
12.4 Five Forces Analysis
12.4.1 Threat of New Entrants
12.4.2 Bargaining Power of Suppliers
12.4.3 Bargaining Power of Buyers
12.4.4 Threat of Substitutes
12.4.5 Competitive Rivalry
13 Vegetable Wax Market by Product
13.1 Market Snapshot & Growth Engine − Revenue
13.2 Market Snapshot & Growth Engine − Volume
13.3 Market Overview
13.4 Candelilla Wax
13.4.1 Market Size & Forecast – Revenue & Volume
13.5 Market by Geography
13.5.1 Revenue
13.5.2 Volume
13.6 Carnauba Wax
13.6.1 Market Size & Forecast – Revenue & Volume
13.7 Market by Geography
13.7.1 Revenue
13.7.2 Volume
13.8 Castor Wax
13.8.1 Market Size & Forecast – Revenue & Volume
13.9 Market by Geography
13.9.1 Revenue
13.9.2 Volume
13.10 Other Wax
13.10.1 Market Size & Forecast – Revenue & Volume
13.11 Market by Geography
13.11.1 Revenue
13.11.2 Volume
14 Vegetable Wax Market by Application
14.1 Market Snapshot & Growth Engine − Revenue
14.2 Market Snapshot & Growth Engine − Volume
14.4 Market Overview
14.5 Candles
14.5.1 Market Size & Forecast – Revenue & Volume
14.6 Market by Geography
14.6.1 Revenue
14.6.2 Volume
14.7 Cosmetics
14.7.1 Market Size & Forecast – Revenue & Volume
14.8 Market by Geography
14.8.1 Revenue
14.8.2 Volume
14.9 Food
14.9.1 Market Size & Forecast – Revenue & Volume
14.10 Market by Geography
14.10.1 Revenue
14.10.2 Volume
14.11 Industry
14.11.1 Market Size & Forecast – Revenue & Volume
14.12 Market by Geography
14.12.1 Revenue
14.12.2 Volume
14.13 Others
14.13.1 Market Size & Forecast – Revenue & Volume
14.14 Market by Geography
14.14.1 Revenue
14.14.2 Volume
15 Vegetable Wax Market by Distribution Channel
15.1 Market Overview
15.1.1 Manufacture, Production, & Distribution
15.1.2 Distribution through Wholesale Channels
15.1.3 Distribution through Online Channels
16 Vegetable Wax Market by Geography
16.1 Market Snapshot & Growth Engine − Revenue
16.2 Market Snapshot & Growth Engine − Volume
16.3 Geographic Overview
17 North America
17.1 Market Overview
17.1.1 Historic Data 2017−2018
17.2 Pest Analysis
17.2.1 Political
17.2.2 Economic
17.2.3 Social
17.2.4 Technology
17.3 Market Size & Forecast
17.3.1 Revenue
17.3.2 Volume
17.4 Product
17.4.1 Market Size & Forecast – Revenue
17.4.2 Market Size & Forecast – Volume
17.5 Application
17.5.1 Market Size & Forecast – Revenue
17.5.2 Market Size & Forecast – Volume
17.6 Key Countries
17.6.1 Market Snapshot & Growth Engine – Revenue
17.6.2 Market Snapshot & Growth Engine – Volume
17.7 US
17.7.1 Vegetable Wax Market Size & Forecast – Revenue & Volume
17.8 Canada
17.8.1 Vegetable Wax Market Size & Forecast – Revenue & Volume
18 APAC
18.1 Market Overview
18.1.1 Historic Data 2017−2018
18.2 Pest Analysis
18.2.1 Political
18.2.2 Economic
18.2.3 Social
18.2.4 Technology
18.3 Market Size & Forecast
18.3.1 Revenue
18.3.2 Volume
18.4 Product
18.4.1 Market Size & Forecast – Revenue
18.4.2 Market Size & Forecast – Volume
18.5 Application
18.5.1 Market Size & Forecast – Revenue
18.5.2 Market Size & Forecast – Volume
18.6 Key Countries
18.6.1 Market Snapshot & Growth Engine – Revenue
18.6.2 Market Snapshot & Growth Engine – Volume
18.7 China
18.7.1 Vegetable Wax Market Size & Forecast – Revenue & Volume
18.8 India
18.8.1 Vegetable Wax Market Size & Forecast – Revenue & Volume
18.9 Japan
18.9.1 Vegetable Wax Market Size & Forecast – Revenue & Volume
18.10 Australia
18.10.1 Vegetable Wax Market Size & Forecast – Revenue & Volume
18.11 South Korea
18.11.1 Vegetable Wax Market Size & Forecast – Revenue & Volume
19 Europe
19.1 Market Overview
19.1.1 Historic Data 2017−2018
19.2 Pest Analysis
19.2.1 Political
19.2.2 Economic
19.2.3 Social
19.2.4 Technology
19.3 Market Size & Forecast
19.3.1 Revenue
19.3.2 Volume
19.4 Product
19.4.1 Market Size & Forecast – Revenue
19.4.2 Market Size & Forecast – Volume
19.5 Application
19.5.1 Market Size & Forecast – Revenue
19.5.2 Market Size & Forecast – Volume
19.6 Key Countries
19.6.1 Market Snapshot & Growth Engine – Revenue
19.6.2 Market Snapshot & Growth Engine – Volume
19.7 UK
19.7.1 Vegetable Wax Market Size & Forecast – Revenue & Volume
19.8 Germany
19.8.1 Vegetable Wax Market Size & Forecast – Revenue & Volume
19.9 France
19.9.1 Vegetable Wax Market Size & Forecast – Revenue & Volume
19.10 Italy
19.10.1 Vegetable Wax Market Size & Forecast – Revenue & Volume
19.11 Spain
19.11.1 Vegetable Wax Market Size & Forecast – Revenue & Volume
19.12 Nordic
19.12.1 Vegetable Wax Market Size & Forecast – Revenue & Volume
20 Latin America
20.1 Market Overview
20.1.1 Historic Data 2017−2018
20.2 PEST ANALYSIS
20.2.1 Political
20.2.2 Economic
20.2.3 Social
20.2.4 Technology
20.3 Market Size & Forecast
20.3.1 Revenue
20.3.2 Volume
20.4 Product
20.4.1 Market Size & Forecast – Revenue
20.4.2 Market Size & Forecast – Volume
20.5 Application
20.5.1 Market Size & Forecast – Revenue
20.5.2 Market Size & Forecast – Volume
20.6 Key Countries
20.6.1 Market Snapshot & Growth Engine – Revenue
20.6.2 Market Snapshot & Growth Engine – Volume
20.7 Mexico
20.7.1 Vegetable Wax Market Size & Forecast – Revenue & Volume
20.8 Brazil
20.8.1 Vegetable Wax Market Size & Forecast – Revenue & Volume
20.9 Argentina
20.9.1 Vegetable Wax Market Size & Forecast – Revenue & Volume
21 Middle East & Africa
21.1 Market Overview
21.1.1 Historic Data 2017−2018
21.2 Pest Analysis
21.2.1 Political
21.2.2 Economic
21.2.3 Social
21.2.4 Technology
21.3 Market Size & Forecast
21.3.1 Revenue
21.3.2 Volume
21.4 Product
21.4.1 Market Size & Forecast – Revenue
21.4.2 Market Size & Forecast – Volume
21.5 Application
21.5.1 Market Size & Forecast – Revenue
21.5.2 Market Size & Forecast – Volume
21.6 Key Countries
21.6.1 Market Snapshot & Growth Engine – Revenue
21.6.2 Market Snapshot & Growth Engine – Volume
21.7 Saudi Arabia
21.7.1 Vegetable Wax Market Size & Forecast – Revenue & Volume
21.8 UAE
21.8.1 Vegetable Wax Market Size & Forecast – Revenue & Volume
21.9 South Africa
21.9.1 Vegetable Wax Market Size & Forecast – Revenue & Volume
22 Competitive Landscape
22.1 Competition Overview
23 Key Company Profiles
23.1 CARGILL
23.1.1 Business Overview
23.1.2 Cargill in Global Vegetable Wax Market
23.1.1 Major Product Offerings
23.1.2 Key Strengths
23.1.3 Key Strategy
23.1.4 Key Opportunities
23.2 Huzhou Shengtao Biotech
23.2.1 Business Overview
23.2.2 Huzhou Shengtao Biotech in Global Vegetable Wax Market
23.2.3 Major Product Offerings
23.2.4 Key Strengths
23.2.5 Key Strategy
23.2.6 Key Opportunities
23.3 Koster Keunen
23.3.1 Business Overview
23.3.2 Koster Keunen in Global Vegetable Wax Market
23.3.3 Major Product Offerings
23.3.4 Key Strength
23.3.5 Key Strategies
23.3.6 Key Opportunities
24 Other Prominent Vendors
24.1 ARGAN CO.
24.1.1 Business Overview
24.1.2 Key Strengths
24.1.3 Key Strategies
24.2 BASF
24.2.1 Business Overview
24.2.2 Key Strengths
24.2.3 Key Strategies
24.3 Brasil Ceras
24.3.1 Business Overview
24.3.2 Key Strengths
24.3.3 Key Strategies
24.4 BRENNTAG (EPCHEM)
24.4.1 Business Overview
24.4.2 Key Strengths
24.4.3 Key Strategies
24.5 Croda Industrial Chemicals
24.5.1 Business Overview
24.5.2 Key Strengths
24.5.3 Key Strategies
24.6 Calwax
24.6.1 Business Overview
24.6.2 Key Strengths
24.6.3 Key Strategies
24.7 CARNAÚBA DO BRASIL
24.7.1 Business Overview
24.7.2 Key Strengths
24.7.3 Key Strategies
24.8 FAITH INDUSTRIES
24.8.1 Business Overview
24.8.2 Key Strengths
24.8.3 Key Strategies
24.9 FALCON
24.9.1 Business Overview
24.9.2 Key Strengths
24.9.3 Key Strategies
24.10 FONCEPI
24.10.1 Business Overview
24.10.2 Key Strengths
24.10.3 Key Strategies
24.11 Kavya Impex
24.11.1 Business Overview
24.11.2 Key Strengths
24.11.3 Key Strategies
24.12 Marcus Oil
24.12.1 Business Overview
24.12.2 Key Strengths
24.12.3 Key Strategies
24.13 PJ Group India
24.13.1 Business Overview
24.13.2 Key Strengths
24.13.3 Key Strategies
24.14 Shri Ram Sons Wax
24.14.1 Business Overview
24.14.2 Key Strengths
24.14.3 Key Strategies
25 Report Summary
25.1 Key Takeaways
25.2 Strategic Recommendations
26 Quantitative Summary
26.1 Global
26.1.1 Revenue
26.1.2 Volume
26.2 North America
26.2.1 Product (Revenue & Volume)
26.2.2 Application (Revenue & Volume)
26.3 APAC
26.3.1 Product (Revenue & Volume)
26.3.2 Application (Revenue & Volume)
26.4 Europe
26.4.1 Product (Revenue & Volume)
26.4.2 Application (Revenue & Volume)
26.5 Latin America
26.5.1 Product (Revenue & Volume)
26.5.2 Application (Revenue & Volume)
26.6 Middle East & Africa
26.6.1 Product (Revenue & Volume)
26.6.2 Application (Revenue & Volume)
26.7 Product
26.7.1 Revenue
26.7.2 Volume
26.7.3 Candelilla Wax – Revenue
26.7.4 Candelilla Wax – Volume
26.7.5 Carnauba Wax – Revenue
26.7.6 Carnauba Wax – Volume
26.7.7 Castor Wax – Revenue
26.7.8 Castor Wax – Volume
26.7.9 Other Wax – Revenue
26.7.10 Other Wax – Volume
26.8 Application
26.8.1 Revenue
26.8.2 Volume
26.8.3 Candles – Revenue
26.8.4 Candles – Volume
26.8.5 Cosmetics – Revenue
26.8.6 Cosmetics – Volume
26.8.7 Food – Revenue
26.8.8 Food – Volume
26.8.9 Industrial Applications – Revenue
26.8.10 Industrial Applications – Volume
26.8.11 Other Applications – Revenue
26.8.12 Other Applications – Volume
27 Appendix
27.1 Abbreviations
Select a license type that suits your business needs
Single User Licence
- Report accessible by one user only
- Free 10% or 3 days of customization
- Free post-sale service assistance
- Continuous support through email
5 User Licence
- Report accessible by 5 users within the organization
- Free 15% or 4.5 days of customization
- Continuous support through email and telephone
- Free analyst hour
- Free Upgrade: If an updated report published within 180 days of purchase, you will get the revised report free of charge
Corporate Licence
- Free Datasheet worth $1500
- Report accessible by the entire organization
- Free 20% or 6 days of customization
- Free post-sale service assistance
- Continuous support through email and telephone
- Direct access to lead analysts
- Free analyst hour
- Free Upgrade: If an updated report published within 180 days of purchase, you will get the revised report free of charge
Datasheet Licence
- Report accessible by 1 user only
- Free 15% or 32 hours of customization
- Free post-sale service assistance
- Direct access to lead analysts
Frequently Asked Questions
What is the global vegetable wax market size and growth forecast?
What are the major factors that are driving the global vegetable wax market share?
Who are the leading vendors in the vegetable wax market?
Which segment will contribute maximum revenue to the vegetable wax market?
What are the latest industry trends and drivers in the market?
Other RELATED Reports

Foodservice Disposables Market - Global Outlook and Forecast 2020-2025
Published : December 2019